The Last Time This Happened …
It’s right there, in the chart below.
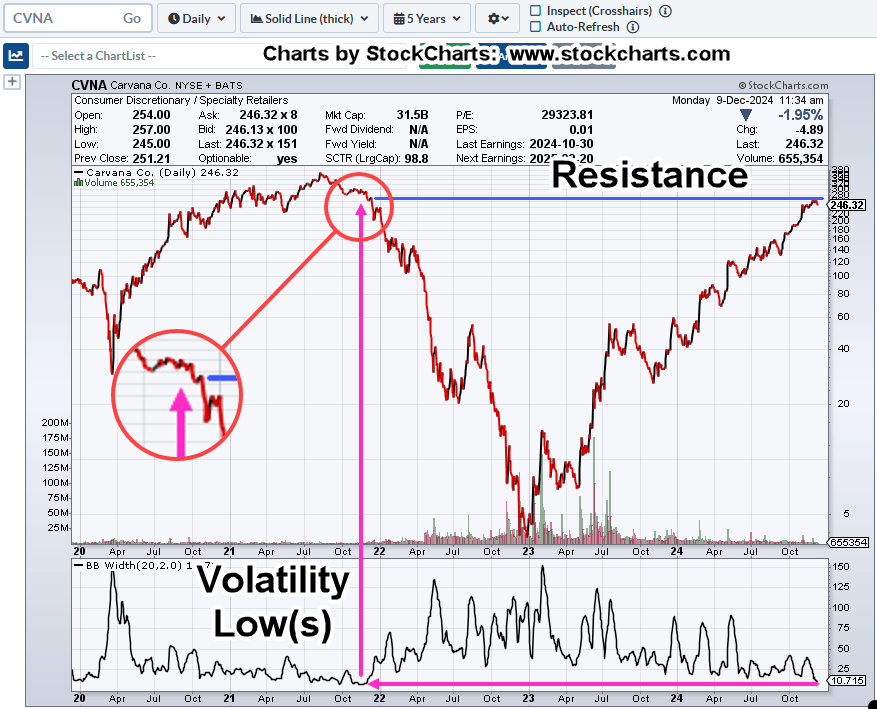
The last time Carvana volatility was this low, measured by Bollinger Band width, was back in late November, early December, of 2021.
That was right before CVNA, began a decline taking it down nearly -99%.
So, here we are.
We have the same (amount of) volatility contraction. Will it be different for Carvana this time?
Carvana CVNA, Daily Close
This post is not recommending any trading action of any type.
We’re just presenting the facts. 🙂
Stay Tuned
Charts by StockCharts
Note: Posts on this site are for education purposes only. They provide one firm’s insight on the markets. Not investment advice. See additional disclaimer here.
The Danger Point®, trade mark: No. 6,505,279

Pingback: Carvana Cracks « The Danger Point®