The Hard Road

Positioning short in the biotech sector (IBB) has not been popular or easy.

Mass hysteria, world-wide hysteria has completely overtaken biotech in a (potentially futile) search and reward for ‘the cure’.  More on that farther down.

shutterstock_689080216

Even before the current stampede, biotech was analyzed by David Stockman and his staff, way back in 2015.  He surmised the entire entourage was nothing more than ‘$2-trillion dollars of bottled air’.

So, if that was then, what about now? 

Now, there’s no ‘price discovery’ of any kind in the equity markets.

There hasn’t been any real discovery for decades … going all the way back to the aborted Head & Shoulders pattern from 1998 – 2002.

Remember that?  A floor was mysteriously put in right at the neckline breakdown, (October 2002) so the market could not go through a much needed washout.

That was potentially the start of major manipulation to ever higher levels and ever bigger bubbles.

So, here we are.  As of this post, after two and a half months of topping action, IBB is in a decisive breakdown.  If it closes at current levels (IBB, 133.57) or below, it not only has downside follow-through from last week’s reversal, it will post a monthly reversal bar as well.

What about ‘the cure’?  Won’t that provide massive profits for the corporations implementing ‘the plan’?

The truth is, it’s getting harder to suppress the truth. 

At this juncture, YouTube, Facebook, Bit Chute and others are playing whack-a-mole with the fact that a resolution to the current situation is not only simple, it’s cheap; Exactly the opposite of the ‘desired’ outcome.

On top of that, one has to consider enough of the public has been fleeced and enough money has been made to the upside, that it’s time to position for downside action.

If we’re to get a sustained reversal, expect the usual suspects to appear; namely, news reports, analysis and recommendations that foist reasons why profits may not be as good as expected.

This is the way the game is played. 

Anyone analyzing P/E ratios, sales numbers or any other fundamental as a ‘reason’ for price action, is living in an alternate universe.

Only time will tell if we’re at a major inflection to the downside.  In the meantime the firm sponsoring this site is heavily short the sector via BIS (not a recommendation).

Note:  The current short position can be exited at any time without update or notice.

Inverse funds are tricky. They have a built in downside (price) bias resulting from expenses maintaining the fund.  They literally can blow-up at any time during an adverse move as was seen with inverse funds DUST and JDST (late March ’20).

These vehicles are absolutely not suited for the ‘average investor’ and even the professional can get impaled on a blow-up every now and then.


Note:  Posts on this site are for education purposes only.  They provide one firm’s insight on the markets.  Not investment advice.  See additional disclaimer here.

Biotech Breakdown … Test

It’s early in the session and biotech (IBB) is testing its reversal breakdown.

This is typical market behavior and for the astute trader, allows a potential low risk opportunity to the short side.

shutterstock_602951669A test may take a few moments or several days.  The market itself defines the time-frame.

The daily chart (below) of IBB, shows a wedge pattern that encountered a ‘throw-over’ and reversal back into the trading range.

A wedge typically occurs at the end of a long-term move, whether up or down and throw-over with return, is a classic time-tested sell (or sell short) signal.

We’re past that signal and have yet another; the test of the underside wedge.

The initial measured move target is shown which if met, puts IBB below several key support levels that would then become resistance.

2020-07-27_8-44-43-IBB-Daily-3-bar-at-open-notes

Reported over the past couple of months on this site is that we’re looking for a strategic long-term reversal in biotech.

Of course, there’s no guarantee of that reversal. 

Each ‘test’ is an opportunity for price action to fail the set-up.  It’s the way of the markets.

As a result, the professional trader or speculator is in a continual state of discomfort.

That’s probably why, years ago in an interview, Robert Prechter Jr. stated that some of the best traders he knew were former Marines.

Short vehicles for IBB (not a recommendation) are BIS (2X inverse) and LABD (3X inverse) which are two well known funds as well as just shorting the ETF directly.


Charts by StockCharts

Note:  Posts on this site are for education purposes only.  They provide one firm’s insight on the markets.  Not investment advice.  See additional disclaimer here.

Silver Up, Then Down

Let’s take a look at silver’s upside breakout.

First off, silver spikes as seen in the chart below, are nothing new.

shutterstock_6325966

Even trading genius Ed Seykota lamented in his interview for Market Wizards (1989) about getting ‘impaled’ on numerous silver spikes.

It’s just the nature of the very thin market.

For example, as of this post, there are 176,008 silver futures contracts active (Open Interest) out to January 2021.

That compares to 835,037 active gold futures contracts for approximately the same time-frame.

So, at this point, the gold market has over 370% more active futures contracts than silver.  Silver is indeed a thin market; therefore lending itself to radical (spike) moves.

The spike lower in March and then higher over the past week, is quite evident.  However, if we pull out and look at the big picture, there’s trouble ahead for the bulls.

2020-07-25_12-38-36-SLV-Weekly-1-bar-landscape-notes

On the SLV chart is a massive multi-year resistance zone in the 23 – 26, area.

Not only that, it’s a 38.2%, Fibonacci retrace of the entire down move from the top in April of 2011, to the bottom in March this year.

Thus, price action itself implies that silver (SLV proxy) is still in a bear market.

The chart allows for the probability of further downside action once the upside objectives are met.  We can see a hint of that downside objective (circled) as somewhere below the 2009, lows.

Of course, expect the market and analysis hysteria to ramp up as (or if) SLV approaches the 25-area.

If or when that happens, we’ll be looking for clues that a reversal is imminent or if by some other measure, “this time is different”, suggesting that silver will continue higher.


Charts by StockCharts

Note:  Posts on this site are for education purposes only.  They provide one firm’s insight on the markets.  Not investment advice.  See additional disclaimer here.

Mission Accomplished!

One day after Pump-n-Dump?, MRNA launches above and closes above resistance on record volume of 103-million shares.

Next day, price action closes below resistance and the trap is set.

2020-07-21_9-49-12-MRNA-Daily-3-bar-notes
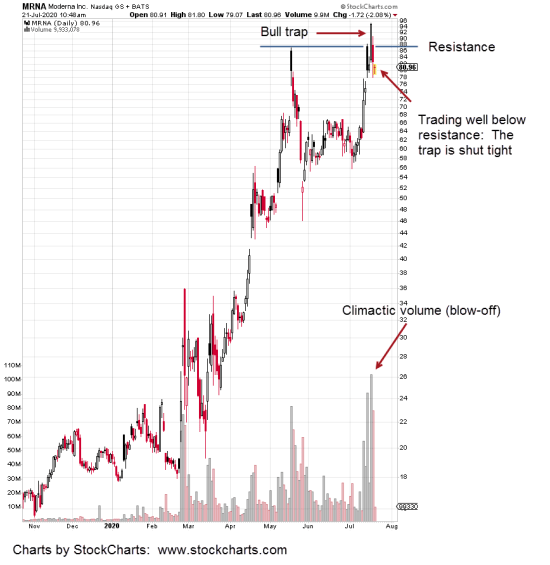
Yesterday (Monday) at the open, MRNA gaps lower -7.4% and didn’t look back.  It closed down -12.83%.

Today, another gap lower.  Price action is hovering in what appears to be an attempt to stabilize.  The question is, stabilize for what?

It probably doesn’t matter as the professionals may have finished their directive.

That is:  establish long positions at low prices, generate news events to get the general public excited, continue to foment the price higher, go all out with maximum volume, exit the longs and establish the shorts.  After that, price action takes care of itself.

That’s the way it works 

Anything can happen and even more (bullish) volume can come from somewhere to drive the price to new highs.

With that in mind, there’s a possibility of an underside test of resistance.  Expectations are that such a test (should it occur) will fail and price action continue lower.

It’s likely we’ve seen the top of MRNA.


Charts by StockCharts

Note:  Posts on this site are for education purposes only.  They provide one firm’s insight on the markets.  Not investment advice.  See additional disclaimer here.

Moderna: Pump-n-Dump?

With the highest daily volume ever, 91-million shares last session, who’s taking the other side?  Of course, it’s a rhetorical question.

The professionals are likely the ones selling and selling-short.

Maybe there are a few amateurs as well who are just starting to figure out how the game is played.  That is, after they’ve blown out their account for the third, fourth, or fifth time.  Account blow-ups seem to be a requirement for every soon-to-be professional.

2020-07-16_9-31-17-MRNA-Daily-3-bar-notes
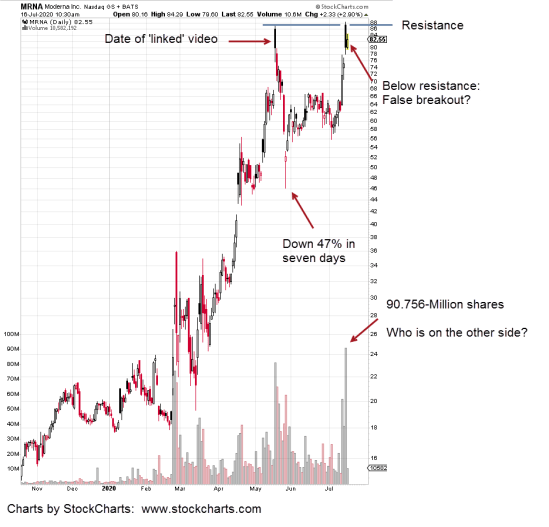
Even with that historic one-day volume, price action could not break through and close above previous resistance (see chart).

Today’s action continues below resistance.  Not a good sign.

We see that biotech fundamentals are out the window and herd (insanity) mentality is at the helm:  Video link here.

The risk of going long (IBB) at this juncture was displayed just a few days ago (Monday, the 13th) when downside action showed just how quickly the bottom can fall out.

What if there’s major rout?  Does anyone really expect their trading platforms to remain operational?

Lest anyone forgets, let’s review what a crash really looks like.

On this site, the impending reversal in biotech has been covered for some time and we’ve been looking to open a strategic, short-position.

With that said, it’s been a frustrating and somewhat expensive endeavor over the past two months to establish that short.

Biotech (IBB) action posted an all-time high yesterday with low thrust energy.  Today we have a new daily low.

It’s lower highs and lower lows.  That may be the signal:

Reversal underway.


Charts by StockCharts

Note:  Posts on this site are for education purposes only.  They provide one firm’s insight on the markets.  Not investment advice.  See additional disclaimer here.


Biotech Higher? Probably Not

Biotech could levitate on higher in the coming week but probabilities say no.

The chart (expandable version here) prints slowing upward energy since April, this year.  It’s clear that each upward thrust has produced less net gain.

2020-07-02_16-58-20-IBB-Weekly-5-bar-notes-BISThe first upward thrust from the end of March to late April, was a solid 28.7%.

After that it was 6.78%, then 2.31% and now last week, all the index could manage was 0.50%.

At this juncture, biotech appears exhausted

Anything can happen.  Price action can move higher in the coming week but it’s a low probability.

A quick internet search of ‘going short biotech’ turns up nothing recent except for this article from May, this year.

The chart of IBB shows the location of the linked article; Just towards the end of the first solid upward thrust.

That was then, this is now

Subsequent thrusts have lost energy.  It looks like we’re at an inflection point.


Note:  Posts on this site are for education purposes only.  They provide one firm’s insight on the markets.  Not investment advice.  See additional disclaimer here.

Trend Change in CORN?

Massive volume inflows into CORN suggest that crop failures, grand solar minimum and controlled demolition of the food supply are all coming to fruition.

iStock-1019396932As reported by Ice Age Farmer at this link, the earth is cooling so rapidly that northern grow areas for corn aren’t warm enough on a go-forward basis, to mature the harvest.

There aren’t enough heat units (known as ‘growing degree days’) to mature the crop, plain and simple.

The result is crop failures on an unprecedented scale.

Couple that with planned, controlled demolition of processing capability; whether it’s not enough harvesting manpower, not enough transportation vehicles, drivers, or whatever excuse can be conjured up, the availability and supply of corn is being crushed.

Corn futures look to have made a long-term bottom and are pivoting to the up-side.


Note:  Posts on this site are for education purposes only.  They provide one firm’s insight on the markets.  Not investment advice.  See additional disclaimer here.