Biotech … Breakdown, Breakout

‘The Court Jester’

Court jesters reveal truths like no other.

How appropriate then, that someone who typically plays the ‘village idiot’ comes out with the truth.

Whether the ‘false narrative’ is finally crumbling or not, is not directly related to analyzing price action.

It does, however, provide the backdrop.

The ‘Big Reveal’

The last update in biotech had this to say (emphasis added):

If this is the big reversal and biotech is the downside leader, unfortunately, that could mean a planned ‘reveal’ by the mainstream media.

What wasn’t known, was just exactly how the truth would come out. Now, we know.

All of which, brings us to the topic at hand: Biotech SPBIO.

It turns out, SPBIO, is trading most consistently, on a three-day pattern.

Biotech SPBIO, 3-Day

In Wyckoff terms, the market itself defines what timeframes and what support/resistance levels are important.

Next up, we’re going to invert the chart to mimic the price action observed on the leveraged inverse fund LABD.

Biotech SPBIO, 3-Day, Inverted

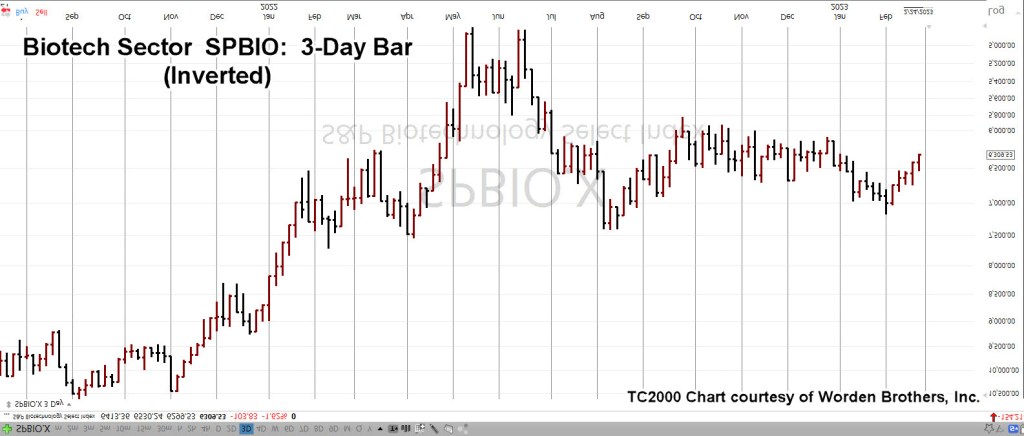
And now, the characteristics of this sector the market itself, has revealed.

At this juncture, SPBIO, trades in a sequence of 3-Days after which, if there’s a directional move, continues on for nine consecutive bars.

After nine-bars, price action typically enters a correction for an undetermined amount of time.

After the correction’s compete the market has (in the past) continued on a directional move for another nine-bars.

Then & Now

We’re currently in a directional move that’s five ‘3-Day Bars’ in thus far.

If the market adheres to its prior behavior(s), we have at least four more ‘three-days’ to go (not advice, not a recommendation).

Note, the current reversal was identified to the day, with this update:

“However, today’s action is consistent with resolution of the five-months of congestion (not advice, not a recommendation).”

The fact the congestion period for SPBIO has taken so long to (apparently) resolve itself, has produced the potential for price action to go farther, last longer than anyone would normally expect.

That move if it happens, connects well with the introduction at the top of this post; a large part of the public has been informed in no uncertain terms, it was all a lie.

The needle, and the damage done.

Stay Tuned

Charts by StockCharts

Note:  Posts on this site are for education purposes only.  They provide one firm’s insight on the markets.  Not investment advice.  See additional disclaimer here.

The Danger Point®, trade mark: No. 6,505,279

Real Estate … After The Reversal

Trading, In The Cannel

Real estate reversed at Fibonacci Week 34, on schedule, as identified in this update.

Since then, it’s been three weeks of closing lower.

‘Boots on the ground’, have been done by numerous YouTubers such as Jerrimiah Babe, Economic Ninja, Dan from i-Allegedly, and others.

Real estate from a fundamental standpoint is in free-fall (not advice, not a recommendation).

Supporting data can be found at this link; time stamp 3:10 and 5:25, specifically for real estate.

From the realm of ‘You can’t make this stuff up’, go to time stamp 7:25, in the above link and look at the price of Telsa.

However, let’s not wander too far off and get back to the ‘implosion du jour’, real estate. 🙂

Real Estate IYR, Weekly

If this channel is in-effect, meaning the ‘demand’ side is a long way down, the trading potential is enormous (not advice, not a recommendation).

With that said, let’s look at the daily chart and potential Put option trade.

Real Estate IYR, Daily (Close)

The market itself, the weekly above, has shown us it’s following a Fibonacci sequence … for now.

Getting down to the daily, on a close basis, we’re presenting one of an infinite number of potential moves.

It’s the upward move (if it happens) to test the channel line that’s the spot to watch.

During such a rebound, short dated put options would be decreasing in price significantly.

According to the economic calander, next Friday March 3rd, will have Fed representatives speaking at 11:00 a.m. and 3:00 p.m., EST.

Stay Tuned

Charts by StockCharts

Note:  Posts on this site are for education purposes only.  They provide one firm’s insight on the markets.  Not investment advice.  See additional disclaimer here.

The Danger Point®, trade mark: No. 6,505,279

NVDA & SOXX … Risk Reduced ?

At The Danger Point®, Where Risk Is Least

It does not get much better than this.

The weekly chart of semiconductor index SOXX (below), shows we’ve already had the Wyckoff up-thrust, the reversal.

All that was missing was the test. That is, until today.

The reportedly ‘good news‘ from Nvidia has given the SOXX the excuse to test its reversal.

Pre-market action has Nvidia itself is up +10.61%, and the SOXX currently up +2.42% (8:32 a.m., EST).

Conversely leveraged inverse fund SOXS is down – 7.15%. This is the opportunity (not advice not a recommendation).

Semiconductor Index SOXX, Weekly

With the SOXX open set for higher, risk on a short position (via 3X Leveraged Inverse SOXS) may be reduced as much as the market is going to allow.

Less risk is NOT, no risk.

The market is going through its natural tendencies, and this is an area where there could be a short opportunity (not advice, not a recommendation).

Stay Tuned

Charts by StockCharts

Note:  Posts on this site are for education purposes only.  They provide one firm’s insight on the markets.  Not investment advice.  See additional disclaimer here.

The Danger Point®, trade mark: No. 6,505,279

Short Covering, Into The Close ?

Watch For The Weakest

With today’s heavy downward action, as we head into the close, any number of scenarios could play out.

Work has already been done on INTC, KMX, MRNA, Biotech Leveraged Inverse LABD, and others.

With such a decisive push lower, there could be some kind of short covering late in the session.

For example, as of this post 2:15 p.m. EST, KMX (detailed below) appears to be coming off the day’s lows.

CarMax Weakness

The daily chart has KMX, right a the bottom of a trading channel.

Price action may continue to rebound from this area heading into the close or not.

If there’s a rebound, naturally Put options will begin to decay in value … a desired outcome if one is looking to enter short (at the cheapest price possible).

The bottom of the channel line could be all there is for this week or we could be heading to much lower levels.

It’s up to the trader/speculator to decide (not advice, not a recommendation)

Stay Tuned

Charts by StockCharts

Note:  Posts on this site are for education purposes only.  They provide one firm’s insight on the markets.  Not investment advice.  See additional disclaimer here.

The Danger Point®, trade mark: No. 6,505,279

The Moderna Scenario(s)

Potential Moves … Potential Actions

In the markets, anything can happen.

With that understood, we’ll present three potential scenarios for Moderna (MRNA) price action for the upcoming days, or week(s).

When we last left our chief cook and spike-protein injector, price action was in a downtrend but also in Wyckoff spring position; indicating at least a chance for upside.

As with the CarMax (KMX) analysis, still playing out with Scenario No. 2, and/or No. 3, at this link as the forecasted price action, we’ll show potential Scenario No. 1 – No. 3, for MRNA, below.

Moderna MRNA, Daily, Forecasted Action

Scenario No. 1

Upside wedge breakout

Scenario No. 2

Downside wedge breakout with no test

And now, the most probable, ‘If there’s a downside breakout.

From a short-dated options standpoint, Scenario No. 3, is the most desirable (not advice, not a recommendation).

If there’s a downside breakout with no test, there’s always the possibility at some point, there will be a test, which in turn completely wipes out any potential gain in the (put) trade; time would run out and the option expires.

Re-Visiting, Elder

Recall, in the example that Dr. Elder gave, he bought OEX Put Options at 3/8-ths, back in the day when the markets traded in fractions.

Three-eighths is 0.375, which gives a target value on which option to select (not advice, not a recommendation).

To get to that small of a fraction, the option’s either way out of the money, short on time, or both.

Stay Tuned

Charts by StockCharts

Note:  Posts on this site are for education purposes only.  They provide one firm’s insight on the markets.  Not investment advice.  See additional disclaimer here.

The Danger Point®, trade mark: No. 6,505,279

Moderna … Options Strategy

Trend Contact … Then, Pivot Down

With a potential right-side trend (and channel) contact confirmed; shown below at – 86% annualized, odds are now favorable for a Put strategy.

In addition to the technical factors discussed, listed at the bottom of this post are no fewer than 22-links to the current fundamental state of biotech and their ‘handiwork’.

The weekly chart of MRNA, has a Wyckoff Up-Thrust and a test, confirmed by the downside pivot.

Moderna MRNA, Weekly

Notice the reversal action took place at a very weak Fibonacci 23.6% retrace.

The two blue lines on the daily chart (below) are exactly parallel.

The grey lines are parallel to the blue lines and intended to show MRNA, exhibits a repeating (downtrend) pattern.

Moderna MRNA, Daily

The expanded version on the daily has support being penetrated (horizontal blue line) and then ‘spring’ action last Friday as a result.

Of course, it’s ‘what happens next’, that’s the question.

In a prefect scenario, price action would thrust lower for a day or several days and then come back up to test the underside of resistance.

Elder Option Strategy

This strategy is taken from Elder’s book ‘Come Into My Trading Room’, and seeks to use as short-dated options as possible.

Doing so, requires the discipline to wait sufficient amount of time for price action to get into position and for option time value to bleed-off.

Potential Upside

Since we’re already in spring position and price action moved off the lows on Friday, MRNA could continue the upside right back to, or past the downtrend line.

However, with massive (undeniable) fundamentals building buy the day, and MRNA being mentioned specifically in at least one link below, probabilities favor the downside.

Supporting Links For The Bearish Stance

Florida Surgeon General Warns Life-Threatening VAERS Reports Up 4,400 Percent Since COVID-19 Vaccine Rollout

US Says Government, Not Moderna, Should Face COVID-19 Vaccine Lawsuit

New Medical Codes For COVID Vaccination Status Raise Concerns Among Experts

Watch: Rand Paul Grills School Of Nursing Head On Student COVID Vaccine Mandate

US Navy Lifts COVID Vaccine Mandate For Sailor Deployment

Mainstream Media Continues To Push False ‘COVID Heart’ Narrative To Explain Excess Deaths

NFL Players’ Association Urged To Screen for Heart Issues Over Vaccine Side Effects

WHO Suddenly Shelves Plans For Second Phase Investigation Into Origins Of COVID-19: Report

Watch: CDC Director Suggests It Will Never Change Child-Masking Policy

Rand Paul Introduces Bill To Halt Funding For Hospitals Denying Care To The Unvaxxed

Welfare State Weakens… 30 Million Americans Are About To Lose ‘COVID’ Food Stamp Handouts

IMF Says World Needs To Prepare For The “Unthinkable” After COVID, War In Ukraine

COVID Emergency, Climate Emergency: Same Thing

Novavax To Sell US Government 1.5 Million More Doses Of COVID-19 Vaccine

“World’s First” Unvaccinated Dating Service Launches In Hawaii

Living The Lie

‘COVID-Curing’ Sorrento Therapeutics Plunges After Filing For Chapter 11 Bankruptcy Protection

What Can We Learn From The Biggest Lies People Believed About COVID?

Censorship Operations: COVID, War, And More…

CDC Director Defends Mask Mandates After New Study Shows Masking Has Little Effect

Bivalent COVID Vaccines Perform Worse Against Variant Now Dominant In United States: Studies

COVID NEWS COMPILATION WITH NUMBER 33

Stay Tuned

Charts by StockCharts

Note:  Posts on this site are for education purposes only.  They provide one firm’s insight on the markets.  Not investment advice.  See additional disclaimer here.

The Danger Point®, trade mark: No. 6,505,279

Options Trade … Intel (INTC)

Looking For The Set-Up

Intel’s a dog … and has been for a very long time.

How do we know that? The price action itself, tells us.

Looking at the weekly chart of INTC, overlaid with the SOXX (thin black line), it’s clear, things literally went south for INTC, right around April, of 2021.

Intel reversed while the sector, the SOXX continued higher.

It’s what happened next, that’s important.

Intel INTC, With SOXX, Weekly

Note how the SOXX has rebounded since mid-October last year while Intel has remained flat.

Even with all the market manipulation to keep the major indices trending higher, having the public thinking ‘the consumer is strong’, INTC has languished.

This lack of upward price action in a rising market, indicates significant weakness.

Has Intel reached a bottom? This is the ‘dip’, isn’t it?

‘Go ahead, make my trade‘. 🙂

As always, anything can happen and INTC, could launch higher from here. However, it’s not likely.

It’s a juggernaut and at the moment, heading lower.

All of which brings us to the set-up: Options trade to the short side.

Intel INTC, Daily

For a viable Put trade, at least two criteria need to be met (with downtrend already established) and those are: Option time bleed, and what’s called ‘price instability’ or a ‘test’.

The daily close of INTC, shows a prior set-up (‘Test’) and now, at the far right of the chart, forecasted action.

A possible time for the ‘test’ if it occurs would be this coming Wednesday as that makes it ‘Day 13’ from the high on February 3rd.

That day would also coincide with the Fed minutes being released at 2:00 p.m., EST.

Note: When Fibonacci time counts are involved, it was determined years ago (by my firm), when the U.S. market is closed for a holiday and the rest of the world markets are open, it can (and sometimes does) count as a Fibonacci trading day.

Therefore, with world markets open this Monday, and the U.S. closed, it may still count as a Fibonacci trading day.

That in turn, could make this Tuesday ‘Day 13’ (not advice, not a recommendation).

Stay Tuned

Charts by StockCharts

Note:  Posts on this site are for education purposes only.  They provide one firm’s insight on the markets.  Not investment advice.  See additional disclaimer here.

The Danger Point®, trade mark: No. 6,505,279

Bond Breakdown … Rates Higher

Nail, In The Coffin

If there was any remaining hope for the economy, the next leg lower in bonds (with rates higher) should just about take care of it.

Of course, if one knows what’s likely to happen, then preparations can be made.

The breakdown in bonds is already underway and this morning’s pre-market action (as of 9:08 a.m., EST) is more of the same … down.

The daily chart of bond proxy TLT, shows the wedge and measured move. With that said, there’s no guarantee of bonds heading lower, just probabilities.

Also, if bonds go lower there’s nothing that says they can’t just keep going … with rates ever higher.

Bonds TLT, Daily

Of course, one does not have to sit idly by and watch their account(s) be decimated with persistent down moves.

Leveraged inverse bond fund TBT, has been around a long time; it’s a viable tool to either hedge positions or trade outright (not advice, not a recommendation).

Leveraged TLT, Inverse: TBT, Daily

Within the past two weeks, TBT, is up over +11%, which is quite respectable for a bond fund.

Stay Tuned

Charts by StockCharts

Note:  Posts on this site are for education purposes only.  They provide one firm’s insight on the markets.  Not investment advice.  See additional disclaimer here.

The Danger Point®, trade mark: No. 6,505,279

Newmont, Approaching “Free-Fall”

Ratcheting Its Way Down

Newmont (NEM) price action’s working its way lower to a ‘free-fall’ area; shown below.

Depending on behavior if or when it gets to this area, there could be an acceptable set-up to execute an ‘Elder-type’ Put option (not advice, not a recommendation).

That Put strategy has already been discussed but for those who may be new, it’s basically a short-expiration, out-of-the-money Put for maximum (potential) gain.

A completely counter-intuitive approach to the standard method of long-dated entries, then ‘wait’ while the value burns down to nothing.

Newmont Mining NEM, Daily

The compressed chart has the big picture; Newmont’s all-time highs were reversed on April 18th, 2022.

It’s currently in the process of finding its long-term bottom which is possibly far away from current levels.

The next chart gets close in on the potential set-up.

If price action follows its current down-trend, NEM may reach the potential free-fall area late next week.

Stay Tuned

Charts by StockCharts

Note:  Posts on this site are for education purposes only.  They provide one firm’s insight on the markets.  Not investment advice.  See additional disclaimer here.

The Danger Point®, trade mark: No. 6,505,279

ccc

The Netflix, Set-Up

Another ‘Implosion’, Waiting To Happen

Get woke, go broke, right?

Corporations control the ‘woke’ part.

What can’t be controlled is when the ‘broke’ part shows up.

We can, however, discern a potential inflection point … or, points.

In the case of Netflix (NFLX), that inflection appears to be happening now (not advice, not a recommendation).

Netflix NFLX, Weekly

Two weekly charts are shown.

The first has the terminating wedge, tentatively confirmed with last week’s new weekly low (below NFLX: 348.71).

The second chart shows the Fibonacci retrace to the 38.2% level; if there’s a reversal and the level holds, it indicates weakness and higher probability for continued downside action.

Note how the wide, high-volume bar of week ending 4/22/22, has been completely retraced.

This is what markets do; they tend to come back and test wide, high-volume areas.

In the case of NFLX, that test required about 40-weeks to accomplish.

Summary & Strategy

Price action itself will define the potential strategy (not advice, not a recommendation).

Based on where the overall markets closed on Friday, the expectation is for more downside action at the next open, then followed by a retrace that day, or the next.

If it happens, we’ll look at NFLX, on the daily chart for additional set-up clues.

Stay Tuned

Charts by StockCharts

Note:  Posts on this site are for education purposes only.  They provide one firm’s insight on the markets.  Not investment advice.  See additional disclaimer here.

The Danger Point®, trade mark: No. 6,505,279