Amgen: Head & Shoulders

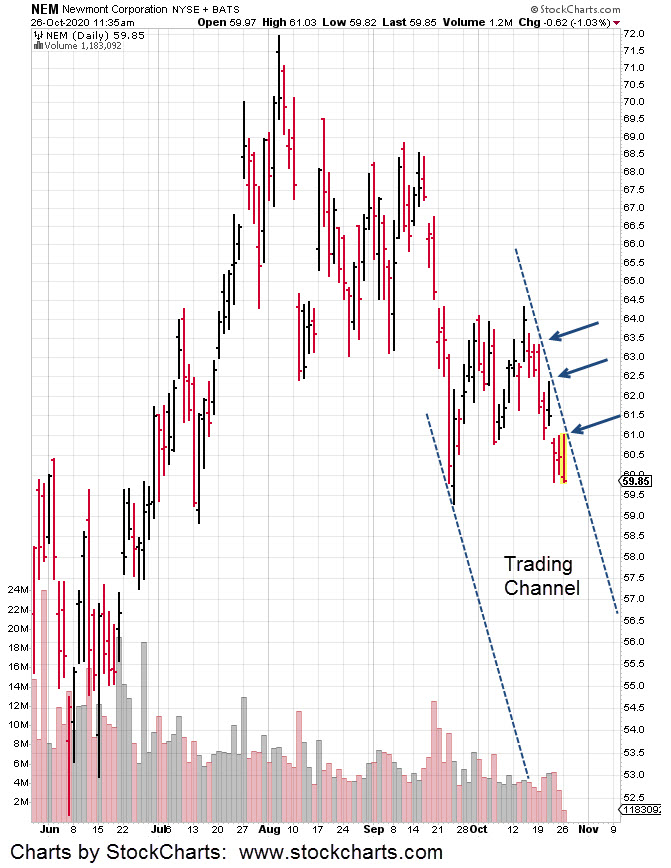
Like Newmont is to GDX, so is Amgen to IBB. 

It’s the heavy hitter. If we decipher what’s going on with it, then we can trade biotech for (potential) profit.

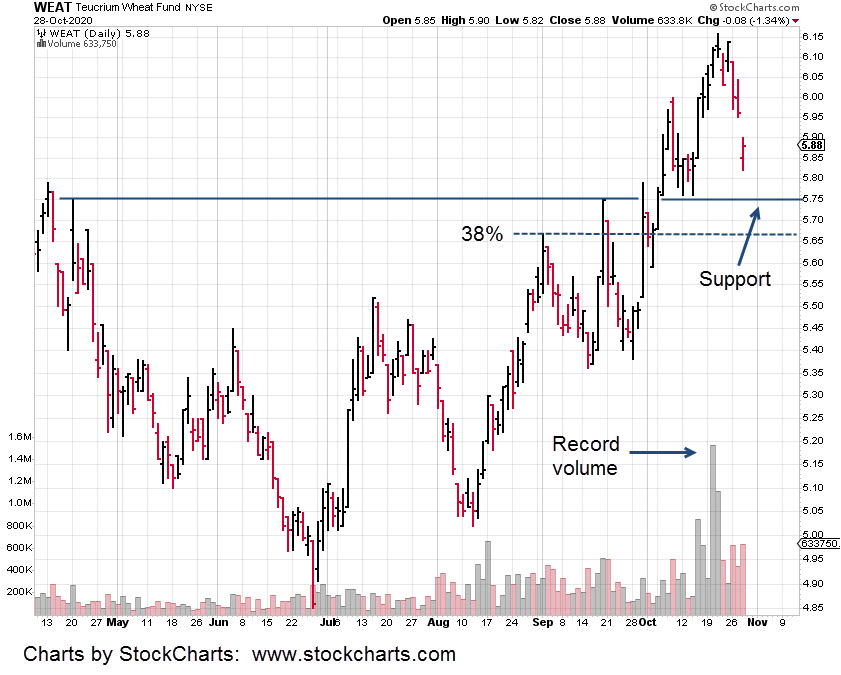
The chart shows price action began to retrace off the lows for the week.  In doing so, it created a possible neckline.

The 38% retrace area, marked with the dashed line, also shows it’s a juncture between weekly bars; the circled area.

That’s a trading tip … watch the circle.

If price action gets to 38% and stalls, it shows weakness. 

Our interest is to look for shorting opportunities.  Specifically, via the 2X Inverse Biotech, BIS. 

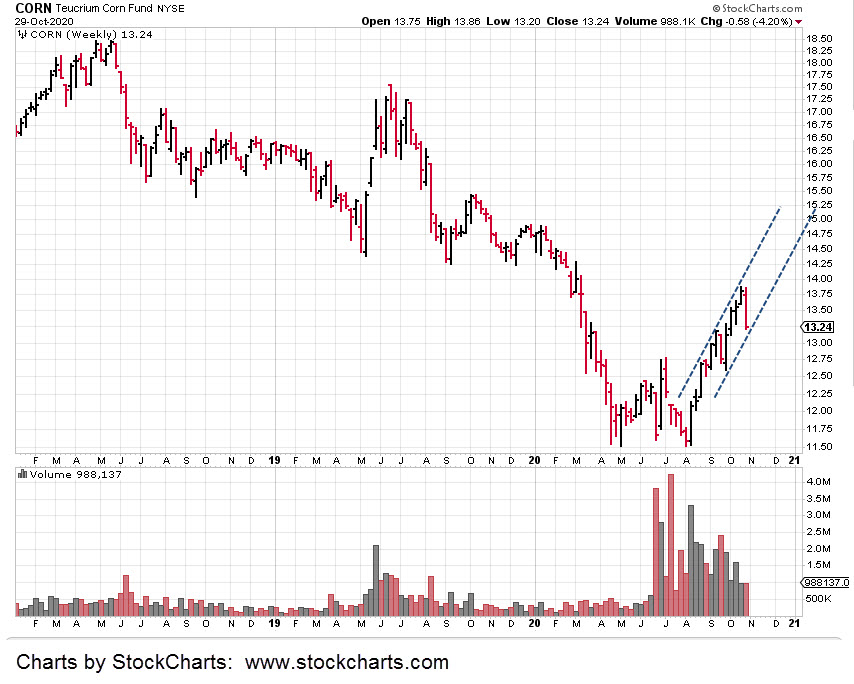
For years now, except for energy (nat-gas) and commodities (corn, wheat, et al), markets are being worked from the short side.

Steven Van Metre presents an excellent case for a deflationary impulse first before there’s any inflation.

The ‘macro’ as he calls it, provides a backdrop for what’s really going on. 

For now, the action (not advice, not a recommendation) is to watch AMGN play out.  If the trading is choppy, overlapping and laboring into the 38% level, then we have our answer.

Charts by StockCharts

Note:  Posts on this site are for education purposes only.  They provide one firm’s insight on the markets.  Not investment advice.  See additional disclaimer here.

CORN Update

Back in the day, Livermore talked about how he established positions for a directional move … a move that would last days, weeks, or longer.

In his fictionalized biography, Reminisces of a Stock Operator he said words to the effect, take a full size position early; then leave it alone.

We are at the danger point for CORN make no mistake.  Price action penetrated previous well established support and stopped dead.

Our initial position (not a recommendation, not advice) was entered about seven minutes before the close on Thursday.  Doing so, gave an entry that was just 0.04 points from the lows of the day.

The expectation for today’s session was for prices to rise immediately; which they did.

During this session, the initial position was increased by 50% (pyramiding) and the stop left (around 10.10 – 10.18) for now.

The risk of course, is what happens when the crop report is released just at the close on Monday.

It’s not what’s in the report that’s important.  It’s the ‘excuse’ to move prices around that’s important.

Of course, we could be stopped out beforehand.  Anything can happen.

The weekly chart shows a potential trend line and channel.  Downward thrust has dissipated when compared to the last weekly move lower (9/25/20).

The only real negative from today’s session; volume was light.

Stay Tuned 

Charts by StockCharts

Note:  Posts on this site are for education purposes only.  They provide one firm’s insight on the markets.  Not investment advice.  See additional disclaimer here.

Going Long CORN

The daily chart shows detail of the initial position in CORN. Expandable version of the chart is here.

More info on the Teucrium CORN Fund is here.  Essentially, the fund tracks an amalgamation of three corn futures contacts.

Price action mimics, but is not directly related to the front month.

From a trading standpoint, the job of the sponsor firm is to locate two types of market set-ups or their failures (as in the case of GDXJ).

Those set-ups are denominated as a Wyckoff “Spring” or “Up-thrust”.

More detail on Wyckoff can be found here for those interested.  It should be noted, Wyckoff is well known in the industry but kept close to the vest.

Back to CORN.  The actual physical stop is not determined at this time.  The pre-market bid/ask spreads indicate a higher open for CORN.

If CORN penetrates the prior session’s daily high, the stop will be set a few ticks below at that session’s low (~13.18).

Fundamentals are in favor of continued higher prices: 

Record (and earlier than normal) cold moving into the growing areas. 

Weather anomalies (inland hurricanes) and spontaneous combustion of grain silos are all part of the picture.

Note:  Posts on this site are for education purposes only.  They provide one firm’s insight on the markets.  Not investment advice.  See additional disclaimer here.

Corn Trading Channel

CORN has been in a trading channel for months. The weekly chart below shows CORN at the right side of the channel.

Today’s session was quite narrow with price action closing just below existing support.

It’s in Wyckoff spring position.  Higher prices are expected (not a recommendation, not advice).

Charts by StockCharts

Note:  Posts on this site are for education purposes only.  They provide one firm’s insight on the markets.  Not investment advice.  See additional disclaimer here.

Wheat: Looking For a Trade

It’s been a while since wheat and more specifically, WEAT has been covered.

The potential hyper acceleration from the last report has not materialized … yet. 

What we do have, is price action setting up for a potential trade.

Well established support is shown along with the location of the 38% retrace area.

Next crop report is due out on Monday, the 2nd, but here’s the catch.  The report is to be released at 4:00 p.m. EST; just as the regular session is closing.

It should be noted at this point in time, what’s in the crop report is (and will be) essentially meaningless. 

We’re focused on price action and that alone.

Fundamentally, we know that around 10% of the corn crop was destroyed by the Derecho. Earlier than normal record cold weather has moved into the crop producing areas.

Charts by StockCharts

Note:  Posts on this site are for education purposes only.  They provide one firm’s insight on the markets.  Not investment advice.  See additional disclaimer here.

JDST Trade Yields Gain: 18.63%

The JDST trade, discussed over the past several weeks has been closed as of today.

Price action in the Junior Mining Index, GDXJ, declined sharply during the day but failed to decisively penetrate support at the 52.00 area.

Combined entry price for three separate JDST entries (9.98, 10.38, 10.58) was 10.19.  Exit price was 12.09.

Since the short trade was executed with the leveraged inverse fund JDST, we’re not going to wait around to see what happens next.

Inverse funds have a habit of ‘blowing up’ as happed with this exact fund just a few months ago.

These vehicles are absolutely not for the novice and even the experienced pro can get impaled on them every now and then.

In fact, the last substantial trade in JDST was closed out on March 12th, 2020.  That exit was just two days before the fund had its monster disconnect.  Enough said.

On a separate note; because of the price action and position of NEM, it’s now in Wyckoff spring position. It thus has the potential to move higher from here.

Note:  Posts on this site are for education purposes only.  They provide one firm’s insight on the markets.  Not investment advice.  See additional disclaimer here.

The Squeeze Is On

Pre market activity (8:31 a.m. EST) has TLT trading up +0.74, at 161.29, which is above the target level set in the last update.

We’ve already laid the groundwork for the ‘speculator’s’ short position in bonds as the largest in history.

It’s the ‘commercials’ that know their markets and in this case (according to Steven Van Metre), the commercials are the banks.

Isn’t it interesting. The banks always get their money, right?

Well, that may be about to happen now, as well.

Just a quick digression from today’s update and concerning the Van Metre link above. At time stamp 14:29, he shows a Wyckoff accumulation schematic. Nice.

From a trading standpoint, there are leveraged bond funds such as TMF (not advice, not a recommendation).

However, this firm has never traded that vehicle and is choosing to be short the junior gold miners (JDST) as well as long natural gas (UNG) for its current positioning.

Natural gas (UNG) for a seasonal trade … with some potential supply disruptions thrown in; the Junior Gold Miner short position (JDST) to work the ‘deflation’ side of what’s going on.

Reports here and here, provide documentation on the thinking behind those positions.  Searching for UNG and JDST will give the full gamut of research.

Back to the markets. If we’re doing our job right and there’s a huge down-draft, we’ll already be in position to profit as a matter of course.

Note:  Posts on this site are for education purposes only.  They provide one firm’s insight on the markets.  Not investment advice.  See additional disclaimer here.

October 1987, Is That You?

Price action has an eerie similarity to August 1987 and the months following.

To those old enough … recall how prices just seemed to press higher and higher during the summer months?  Stretched, they were.

Then came a break with a move lower.  After a while, a few weeks or so, it seemed as if the market was going to make another attempt.

The second attempt did not seem as energetic.  Prices continued on though … until they stalled and headed lower.

Just like now?

Continuing on with 1987, price action drifted on down; seemingly with out much fanfare until one day … a Friday there was a huge drop.

That was Friday, October 16, 1987.  We all know the action that followed on Monday.

Getting back to the markets at hand:

The last bond update showed a potential bullish set-up. 

There’s nothing that says bonds can’t start higher now.  In fact, it’s been two up days in a row for TLT.

If TLT penetrates the 160.98, level to the up-side, it’s a classical analysis (not a recommendation, not advice) buy signal on the weekly time-frame.

As of this post (7:01 p.m. EST), the S&P futures are already down -22 points, or about -.65%.  Correspondingly, bonds are higher.       

Charts by StockCharts

Note:  Posts on this site are for education purposes only.  They provide one firm’s insight on the markets.  Not investment advice.  See additional disclaimer here.

Biotech In Position

Biotech (IBB) is now in position to move higher as a test of the trend break from Monday, the 19th.

The chart shows IBB has retraced 68% of the move from the September 4th low, to the October 14th high.

That’s a deep pull-back and suggests weakness. 

However, after a trend-line break, it’s typical market behavior to mount some kind of rally to test the break.

If that happens, part of the test could be a new high. 

We already have a weekly MACD divergence (possible). If the test occurs soon enough, there could be a daily divergence as well.

Weekly and Daily bearish divergences. We’ll see.

Charts by StockCharts

Note:  Posts on this site are for education purposes only.  They provide one firm’s insight on the markets.  Not investment advice.  See additional disclaimer here.

Newmont Hits Trend, Heads Lower

It’s about two hours after the open.

Newmont (NEM) has already tested upward into its trend-line.

Then, it reversed and makes a new daily low.

Not good for the bullish case.

The daily chart shows three hits on the right side line as well as a possible trading channel.

It seems hard to believe. It looks like NEM has seen its highs for the year and possibly much longer.

As always, anything can happen.  It’s still very early in the session and there could be a reversal … although a low probability.

Stay tuned.

Charts by StockCharts

Note:  Posts on this site are for education purposes only.  They provide one firm’s insight on the markets.  Not investment advice.  See additional disclaimer here.