Dumpster Fire … Real Estate

Price Reductions, Accelerating

From a technical perspective, it’s a disaster.

The last post showed price action had nowhere to go but down.

In that post, a trading channel was identified on the weekly chart.

Now, this week, with the action from the past three sessions and possibly a fourth (today), the channel is being confirmed.

Then, we have this:

Price Reductions Accelerating … At Record Pace

As if on cue, to support the assertion from Tuesday’s gold update; specifically:

“We should expect market events to reach never before seen extremes.”

We’re getting that same ‘never before extreme’, in real estate; presenting itself as accelerating price reductions.

At time stamp 5:20 at this link, we can see a graphical presentation of that collapse.

To borrow a quote from Dan at i-Allegedly: ‘Anyone who thinks price reductions are going to taper off, are kidding themselves’.

We’re just getting started.

Real Estate IYR, Daily Close

It’s about fifteen minutes before the open and IYR, is trading down nearly – 2%, in the pre-market.

That action confirms the declining channel shown.

As a result of this week’s apparent pivot (identified in the last post), a new channel appears to be emerging.

This one’s more aggressive.

If the new channel ‘sticks’, real estate trouble’s happening faster than most would expect.

Pulling out a little farther on the chart shows the downside potential.

Declining at nearly – 95%, annualized hardly seems possible.

Nearly everyone has been lulled to sleep with the orderly decline of the markets thus far.

In non-related but nevertheless connected event, the situation world-wide is moving faster, not slower.

It does not matter these events are completely fabricated (as was The Speck).

The effects of the fabrication are real.

Wyckoff Analysis Leads The Way

This week’s reversal off of last week’s trend lines confirms their existence.

Price action itself is leading the way; this is the crux of Wyckoff analysis.

The market itself defines what’s important.

Stay Tuned

Charts by StockCharts

Note:  Posts on this site are for education purposes only.  They provide one firm’s insight on the markets.  Not investment advice.  See additional disclaimer here.

The Danger Point®, trade mark: No. 6,505,279

Panning for Gold @ $1,300/oz.

Gold Could “Unwind”, In A Sharp Decline

As far as is known, no other site has identified, gold (GLD) has “changed hands” with the next probable direction, as sideways or down.

That is, until now.

Sometimes, it literally takes years to find anything useful from mainstream financial media. However, you really can’t blame them; it’s not their job to reveal the truth.

By chance, every once in a while, someone makes a mistake and bits of truth, escape.

That may be where we are with the following Kitco NEWS interview, linked here.

It’s worth a half-hour to watch the entire exchange but for us, the real business starts at time stamp: 19:05.

The Overall Gold, Premise:

If the dollar moves sharply higher and the markets move lower (or crash), gold’s response may be a wash-out to $1,300/oz., or lower.

“Changing of Hands” as identified on this site, was mostly intuitive. We won’t know for sure if it was the (real) inflection point until gold resolves itself.

Now, we have another view from a separate party (above), that at least recognizes gold’s downside potential.

With that said, let’s look at gold (GLD), Quarterly

Gold (GLD), Quarterly Chart

There are only two trading days left in the quarter; it’s reasonable to think we’ll get something similar to the un-marked chart below.

The next chart shows the Wyckoff up-thrust (reversal) along with an attempt to move higher (the test) that was rejected; prices continued lower.

The next chart is the one no gold bull wants to see; downside projection(s).

Using a standard Fibonacci tool, we have the above projections.

If there’s a major unwind of gold positions, price could decline to the GLD, 133-area, corresponding roughly to physical gold @ $1,300/oz.

Uncharted & Unprecedented

The caveat: We’re not in any time that’s happened before (other than maybe the collapse of the Roman Empire).

It’s uncharted territory.

We should expect market events to reach never before seen extremes. That would include the potential for a severe draw-down in gold.

The World, Then

If gold gets to the $1,300/oz level, it would easily be considered a buying opportunity.

What if gold keeps going lower, moving below $1,000/oz?

The second projection, targets approximately $950/oz.

What, then?

What if the $1,300 level, was bought by those with means, using both hands … including massive margin (if it’s still available).

What happens if there’s another leg down; then margin calls?

Can’t happen one might say.

Well, oil going negative for the first time in history couldn’t happen either … until it did.

Stay Tuned

Charts by StockCharts

Note:  Posts on this site are for education purposes only.  They provide one firm’s insight on the markets.  Not investment advice.  See additional disclaimer here.

The Danger Point®, trade mark: No. 6,505,279

Predatory Lending = Collapse

The Top, Is In

Just like the last bubble but worse.

That’s the assessment from agents in the field on the imminent real estate implosion.

Interest rates have risen dramatically, applications have evaporated, properties not moving as before, prices are dropping, lenders deploying the last resort; Adjustable-Rate Mortgages (ARM).

When the ARMs, show up in force, it’s over.

Technical & Fundamental

Over the past several days, the real estate situation has been assessed from both a technical (chart) perspective as well as the fundamentals.

The bottom line (below), is so long, it may have to be covered in several posts.

  • On a weekly and daily close basis, IYR has contacted underside resistance.
  • On a weekly and daily close basis, IYR has contacted the right side of a downward trading channel.
  • Multiple gap-fills at IYR, 91 and 94. Volume declines over – 22.5%, on the second gap-fill.
  • Multiple rising wedge breaks on multiple time-frames signal a potential drop of – 41.5%, from current levels.
  • Trading volume contracting (as price is rising) on multiple time frames, indicates potential lack of trader commitment to higher prices.
  • Financial press gets in the game (with several reports), saying ‘now is the time to buy’.
  • As highlighted above, once the Adjustable Rates dominate, the top is in.
  • This top may be far worse than ’07 – ’08, as debt levels are much higher, consumer is tapped-out and there is a massive ‘elephant’.
  • That elephant is now going mainstream with the resultant effect of unprecedented population decline/disablement.

So, let’s get started.

Real Estate IYR, Weekly Close

Un-marked chart.

Test of underside resistance

Zoom of underside contact.

Right side trendline.

Zoom of contact points.

Trading Channel

Wedge Break: Daily Chart

Zoom of break and test

Wedge Break: Weekly Chart

Note:

A measured move to 55-area, gets IYR, back to 2020 lows. That’s a reasonable expectation for an initial leg down.

If we use Prechter’s assessment concerning bubbles (manias), price action eventually retraces every bit (sometimes more) of the entire bubble move.

That puts the ultimate destination of IYR, somewhere in the vicinity of 14.0, or lower, representing a decline of – 88%.

Closing Argument

Remember this gold breakout?

It was going to be $3,000/oz., in months, not years.

Gold-O-Mania was coming. You could even sign up and pay money to read the group-think of the imminent launch.

Well, obviously at this point, $3,000/oz., is nowhere in sight.

Gold (GLD) is even lower now than it was then. On top of that, the ‘changing of hands’ assessment has not been negated; prices continue to grind lower.

Having the financial press cheerlead at the exact wrong time, is an (almost) necessary component to identify a lasting reversal.

As we can see here and here, the financial media’s position is, we’re heading higher. There is ‘real buying’ (whatever that is) for the first time in weeks.

However, from the chart evidence presented above (and we didn’t even get to ‘gap-fills’, ‘multiple wedges’, ‘contracting volume’ … maybe later), it’s hard to present that price action will somehow move significantly higher.

Price action behavior above, appears to point to an immediate or very near-term downside reversal.

Summary

Lastly, we have this from Activist Post: Real estate housing crash in progress.

Be careful. If you read the article, can you see the ruse?

It’s been discussed before on this site. That is, the real purpose of the Fed.

All is going according to plan.

Stay Tuned

Charts by StockCharts

Note:  Posts on this site are for education purposes only.  They provide one firm’s insight on the markets.  Not investment advice.  See additional disclaimer here.

The Danger Point®, trade mark: No. 6,505,279

Biotech Mid-Session, Update

One Last Low, For LABD

Yet another low for inverse LABD.

Is this trade set-up still viable and/or worth the pursuit?

Short answer (at this point) is yes, and yes.

We’re going to look at the tape (the chart) and let it tell us what’s happening from a Wyckoff analysis perspective.

Since we’ve just past mid-session (12:37 p.m. EST), we’ll use the 4-Hour chart.

Biotech SPBIO, Leveraged Inverse LABD: 4-Hour

The unmarked chart above, looks like a mess.

Volatility everywhere in the past four sessions; including the Fed announcement on June 15th.

The marked-up chart below shows two distinct 4-Hour reversal bars.

Each of those bars were subsequently penetrated to the downside thus negating any entry signals.

However, it’s the next chart that draws from the secrets of Wyckoff analysis.

That is, “Shortening of the thrust”.

Discussed by David Weis in his training video, when thrusts become shorter, probabilities favor we’re nearing the end of the move.

As shown below, net downward thrusts on the chart have narrowed significantly.

Note that each downward thrust has successively less energy as shown on divergence of Force Index.

The next chart zooms-in.

Positioning

Based on the above, as much as price action gives the appearance of moving lower for LABD (higher for SPBIO), the energy to do so, appears to be spent.

Obviously, the accounts being managed have gone through a draw-down over the past trading sessions.

One account was stopped out @ 44.58 and then re-positioned at 44.01. The other account was allowed to draw down (not advice, not a recommendation).

The LABD-22-04, trade remains intact.

Summary

If the trend remains down for SPBIO, it’s highly unlikely the index will make new daily highs beyond this session.

If it does, then we can consider the trade set-up invalid.

A reasonable stop location at this point for inverse LABD, would be near or below the lows for the day (thus far), currently @ 42.37 (not advice, not a recommendation).

Stay Tuned

Charts by StockCharts

Note:  Posts on this site are for education purposes only.  They provide one firm’s insight on the markets.  Not investment advice.  See additional disclaimer here.

The Danger Point®, trade mark: No. 6,505,279

Solstice Reversal

Let’s Not Forget, S&P Bottom @ 666.67

The S&P bottomed out at 666.67, on March 9th of 2009.

Putting it differently; that’s 3/9/09.

When that ’09, bottom is discussed in the financial press, they quickly round it up “667”; nothing to see here.

Market Reversal

The S&P needs to print a new daily low to make it official but our chief cook and bottle washer, biotech, looks like it’s not waiting around.

Pre-market action in (inverse) LABD is already at a new daily high, corresponding to a new daily SPBIO, low.

Once again, the short position was exited during the last session and then re-entered (discussed below) towards the end of the day (not advice, not a recommendation).

Trade LABD-22-03 is closed out; LABD-22-04, now open.

Biotech SPBIO Inverse Fund LABD

The chart shows pre-market action is at this juncture; Fifteen minutes before the open.

The hourly chart below has entry detail along with the current stop.

LABD Hourly

Positioning

With the market to open gap-higher (SPBIO, gap-lower), the first order of business is likely to be an attempt to close that gap.

If there’s going to be an attempt, look for it within the first 90-minutes of trade.

From my firm’s standpoint, the actions are obvious: We’ll be looking to increase the LABD-22-04, position and continue to have a tight stop (not advice, not a recommendation).

Summary

Anyone accessing this site for any length of time is most likely, fully awake.

Go ahead and look up “June 21st” on this calendar; it all makes sense.

If this reversal ‘sticks’ and is the pre-cursor to much lower levels, we know ‘the enemy’ has not changed.

Stay Tuned

Charts by StockCharts

Note:  Posts on this site are for education purposes only.  They provide one firm’s insight on the markets.  Not investment advice.  See additional disclaimer here.

The Danger Point®, trade mark: No. 6,505,279

Biotech … Bulls/Bears

Fight Between Support & Resistance

Last Friday’s action was volatile with the op-ex short-covering apparently coming into play. Biotech was affected more than any other index.

If it really was short covering, then we already know what’s likely to happen next.

First, we’ll go over the charts and then build a case for the next probable direction.

The focus is on SPBIO, instead of IBB, as it’s the weakest of the two indices.

From a weekly standpoint, this is where SPBIO, left-off this past Friday.

Biotech SPBIO, Weekly Bar

Adding the mark-up to show we’re at support and resistance.

Getting closer in on that area.

We can see based on the price action itself, we’re at an important juncture.

Two years ago, in March of 2020, price action formed a support level.

Fast forward to now.

Price action bounced off that same level, attempted to move higher (for over three weeks), was rejected, moved lower, and last week, came back up for an underside test.

Most Probable Direction

If there was a short squeeze as a result of options expiration, fuel for that move is gone.

The options have expired.

in addition, that fuel was only able to get SPBIO, to the underside of resistance.

So, you can see where this is going.

Upside fuel is gone. SPBIO, is currently at underside resistance; most probable direction is down.

Measured Move

If the action from all-time highs during the week of February 12th, 2021, to the current support/resistance area is a trading range, then we may have a ‘Measured Move’ target as shown.

Under the current conditions, i.e., financial, societal, collapse along with the ‘elephant‘ going mainstream, a downside objective that’s an – 85.6%, decline from all-time highs, is entirely reasonable.

The 3X Inverse LABD, Weekly

The unmarked chart

First, the rule of alternation.

Last time is not this time.

Last time there was a reversal bar and the next week continued lower, then lower again and so on.

The rule of alternation says, whatever happened last time will not happen this time. Price action will (likely) have a different form.

Obviously, if the short squeeze referenced above is over and the trend remains down, one could expect LABD, price action to be higher at the next session (SPBIO, lower).

Positioning

The weekly chart shows progression and location of the stop orders on LABD-22-03 (not advice, not a recommendation).

The initial stop has been moved up to last week’s low.

There may be a trading channel as well.

Potential exit target(s) if not stopped out, would be contact points at the upper channel line.

Summary

If the position is stopped out at the next session, we’ll re-evaluate.

If not, and SPBIO, continues to move lower (LABD, higher), we’ll be looking for additional confirmation of the right-side trend line and the next likely area to move the stop.

Stay Tuned

Charts by StockCharts

Note:  Posts on this site are for education purposes only.  They provide one firm’s insight on the markets.  Not investment advice.  See additional disclaimer here.

The Danger Point®, trade mark: No. 6,505,279

Retail Investor … The Apocalypse

Mass Psychosis, At The Edge

Even before we had gone around the room to introduce ourselves, the instructor at Online Trading Academy, Dallas, said he had a important topic to cover.

He wanted to make sure everyone understood the concept. The rest of the seven-day course hinged on the understanding and acceptance of the idea.

What was it?

You may have already guessed: ‘Short Selling’.

The big money is made on the downside … not after, when the bottom is in, although that may happen as well. No, it’s the downside that has the greatest opportunity for profit.

Fear is a much easier emotion to gauge than greed; in that sense, down is easier than up.

Short Selling: Market Trading 101

You would think it’s a no-brainer; that everyone knows this.

Not so.

Years ago, while discussing the markets with a former broker, he asked me, and I quote: “What’s an inverse fund?”

During a business lunch, I asked another broker if he worked the downside for his clients. The response was “They can’t handle the volatility”.

In his case, he knows the vehicles are there (inverse funds) but he doesn’t use them; only working the upside.

Shorting The Market

My first short sale was back around 1995.

I shorted ‘against the box‘, when you could still do so. The short trade was Alcide.

In the May 1993, edition of my newsletter (see About) ‘Market Order Letter’, published by my firm, Equity Research Corporation, Alcide received initial coverage.

Prior to that edition, I managed to get a phone interview with Mr. John Richards, Vice President, and Chief Financial Officer of the company.

Remember that I was simultaneously employed as Engineering Technical Manager, for an avionics company. So, the interview was performed on my lunch hour.

During the call, I had made it past the receptionist, then secretary, and then to Mr. Richards, specifically.

Initially, the interview was not going well.

I could tell he considered me an annoyance and rightly so. That was, until I mentioned the competition and how they were going to deal with that.

At the time, Isomedix, had a plan to irradiate chicken (carcasses) to prevent salmonella. Conversely, Alcide had a product that was sprayed on (i.e. low-tech) and biodegradable.

When I mentioned Isomedix, the tone of the conversation changed instantly. I had done my work; I knew the market and wasn’t some newbie (even in ’93).

Mr. Richards opened up and gave me a fantastic interview discussing all manner of things. I did not tell him I was on my lunch hour and in the end, had to politely say, ‘You must be busy, so I’ll let you go’; thank you for your input.

Alcide (ALCD) was a ten-bagger that ultimately went from about $3/share to above $60/share (actually, a twenty-bagger) before being acquired by Ecolab.

Which brings us back to the ‘Retail Investor’

Still Buying The Dip

One more thing about the trading class mentioned above.

After the short-selling topic was covered, the instructor went on to say, the fact we were sitting in that room, separated us out from the massive herd of ‘investors’.

At that time, there were about 40,000 – 60,000 professional traders in the U.S. Although still neophytes, we were considered in that group.

That’s 60,000 out of 240-million adults, putting the ratio at around 0.03%

Now, on to ‘the dip’.

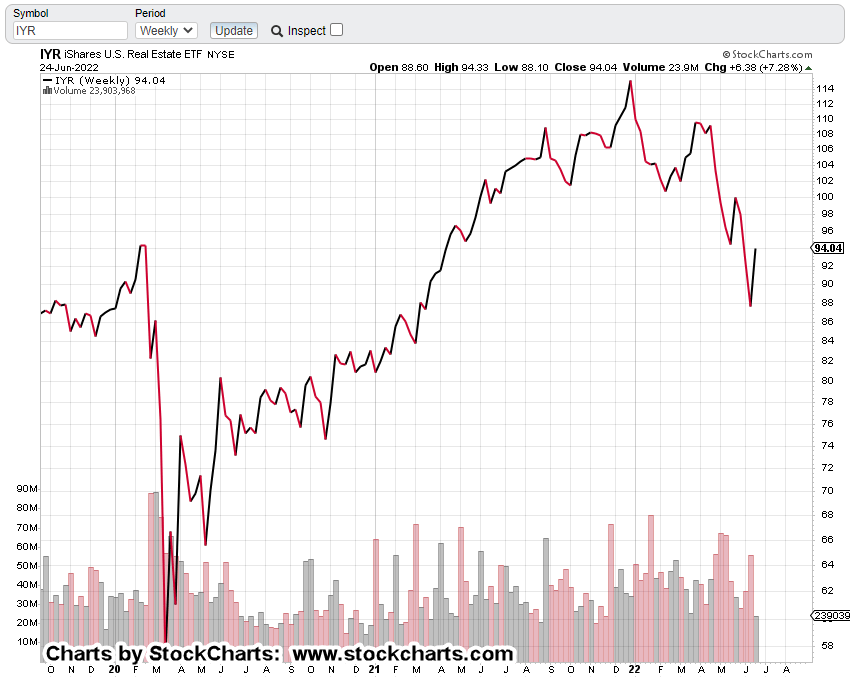
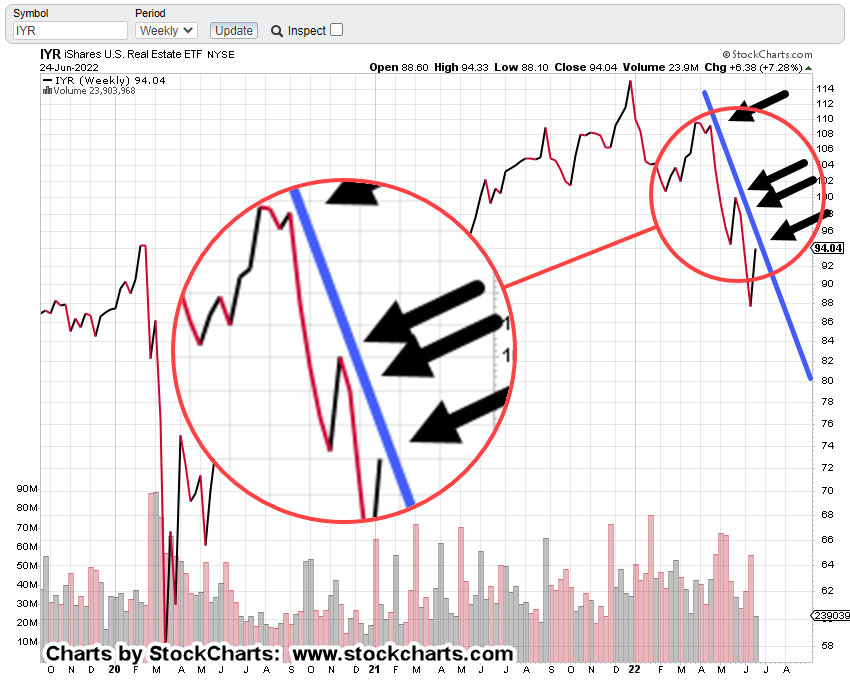
This article out from ZeroHedge has the data saying, ‘Retail’, is still buying the dips although the average portfolio is down a whopping -34%, for the year.

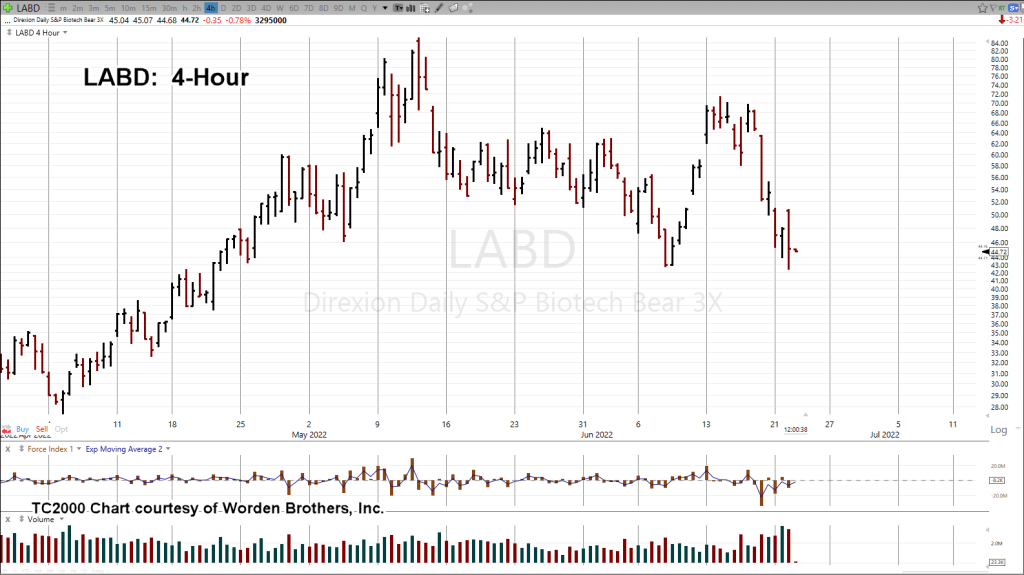
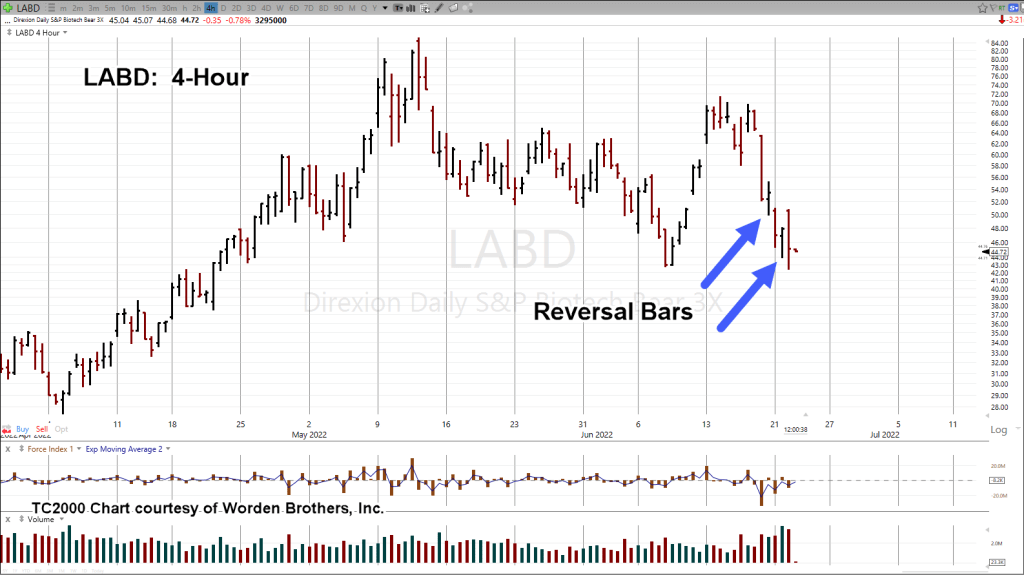
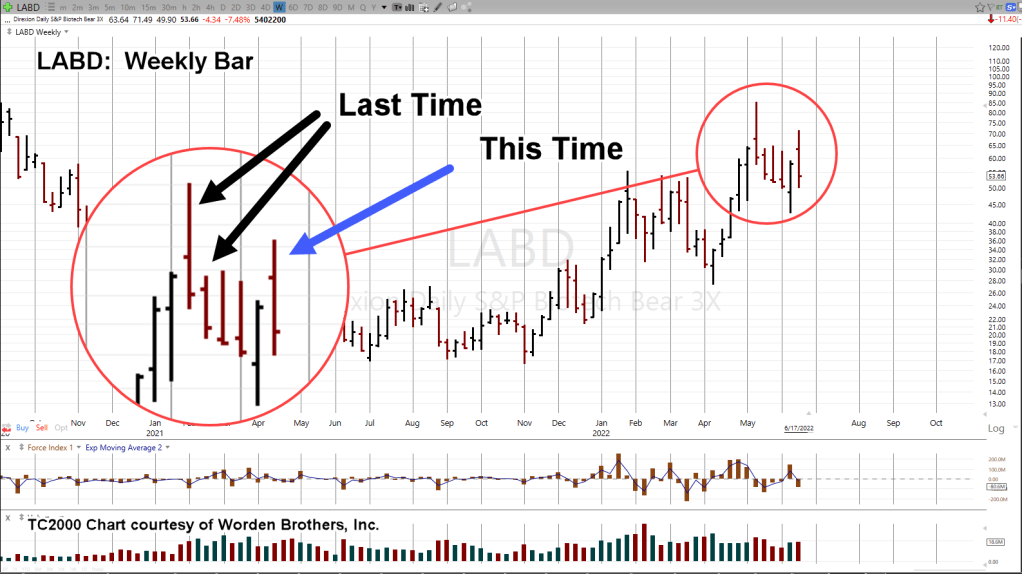
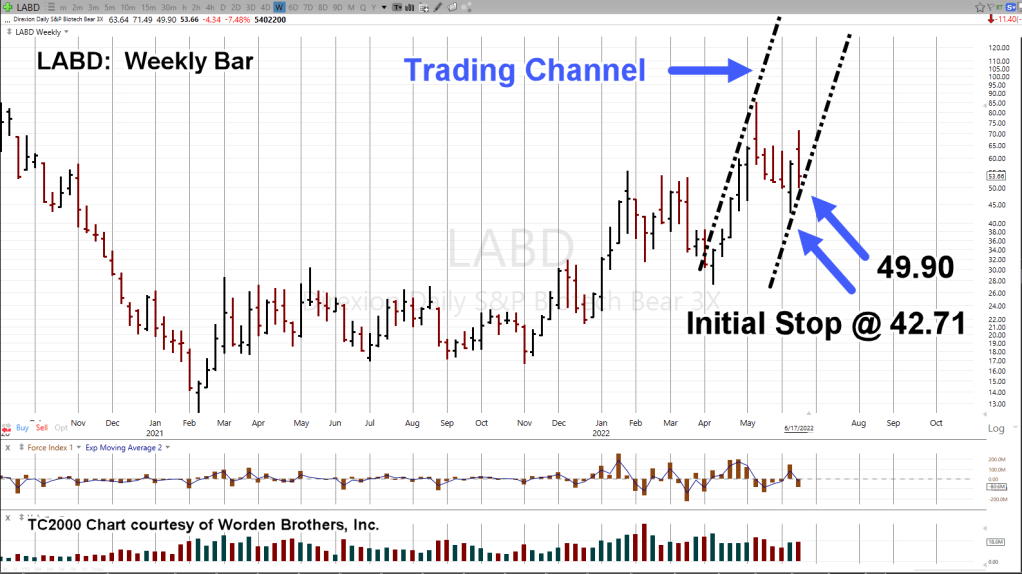
Without getting into specifics, the most conservative account managed by my firm is up over 30%, for the year, which includes the LABD, whack from this past Friday.

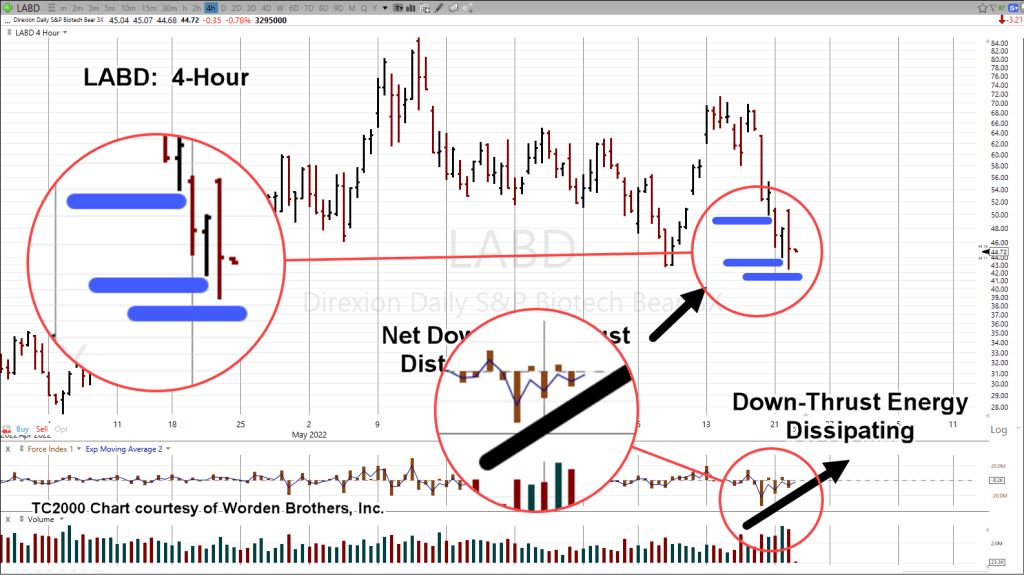
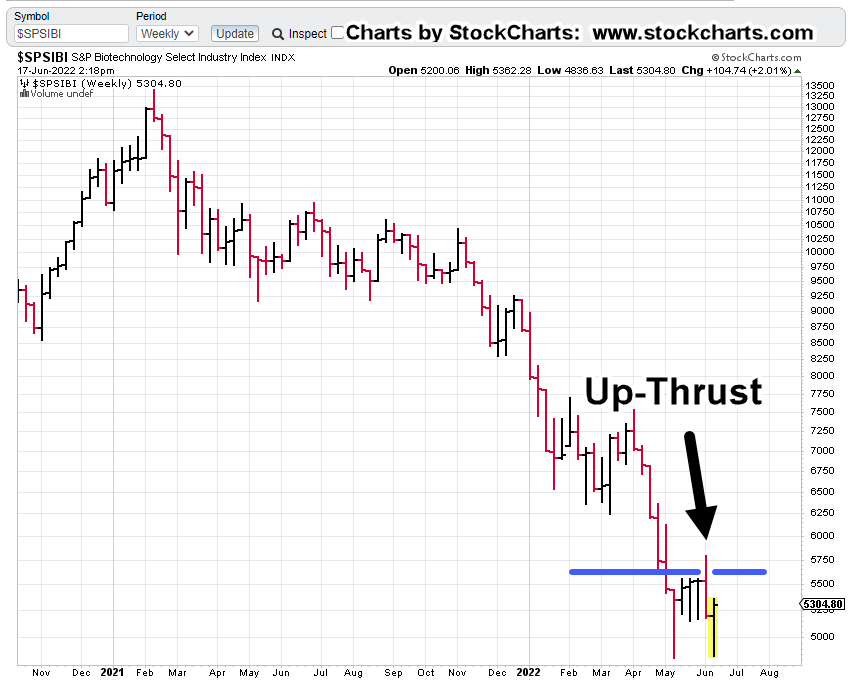
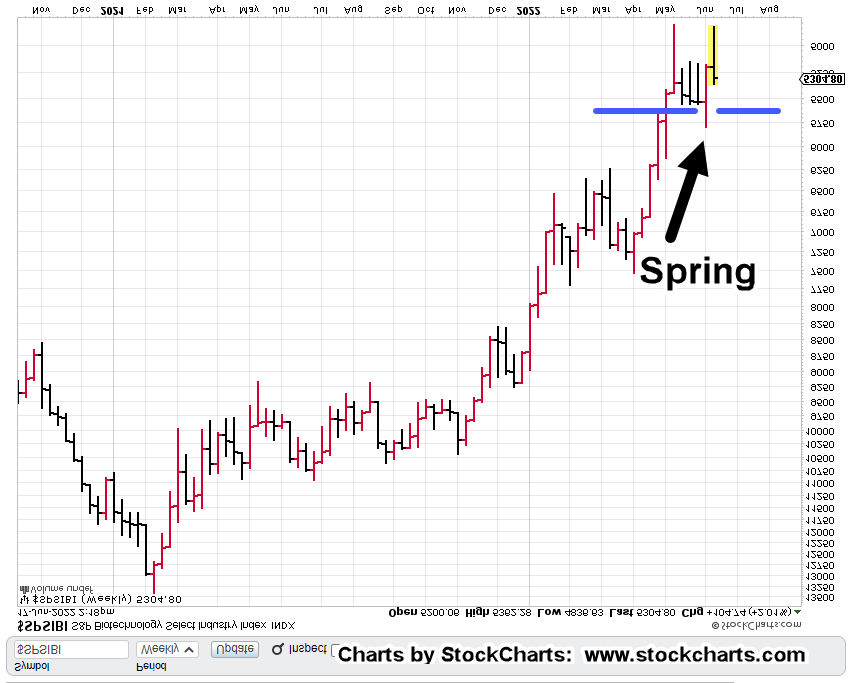
Note: An updated analysis of Biotech SPBIO, inverse LABD, and LABD-22-03, is scheduled for tomorrow.

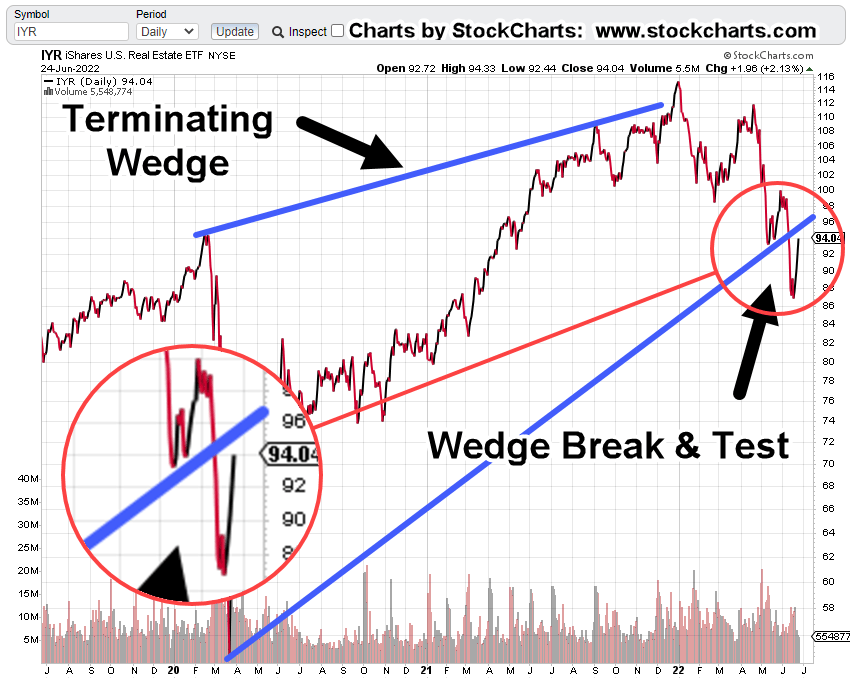
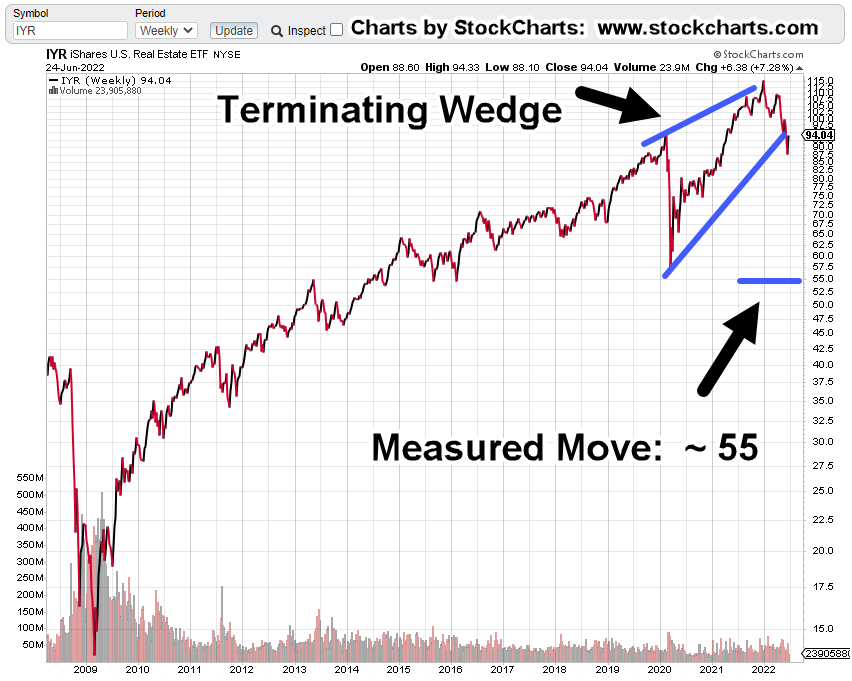
Fuel, For The Downside

Over a century ago, Wyckoff wrote about the behavior of those on the wrong side of the trade.

That is, they are the ones who provide the fuel for the next move. In our case, that would be fuel for the downside.

Investors are buying the dip, because that’s all they know how to do.

It’s a sign of desperation.

Hoping that somehow, the markets will pull them out and return things to ‘normal’.

If you’ve read this far, you already know, ‘normal’ is gone.

Whatever happens next, (except for the starvation) will be completely new.

Stay Tuned

Charts by StockCharts

Note:  Posts on this site are for education purposes only.  They provide one firm’s insight on the markets.  Not investment advice.  See additional disclaimer here.

The Danger Point®, trade mark: No. 6,505,279

Biotech … Squeeze or Test

Maybe, Both

If we look at it from the perspective of an up-thrust test, as we’ll do below, such tests if they don’t fail are the precursor to dynamic moves.

At the minimum, today’s action allows the stop to be moved on short position LABD-22-03 (not advice, not a recommendation).

It’s interesting, the biotech sector both IBB and SPBIO, with inverse funds BIS, and LABD, respectively are the only ones taking a major hit today.

Using a cue from Nicolas Darvas and his observations (as a dancer), the market will initially go opposite its main direction as if to get ready for the move; like a dancer crouching down before lifting the female partner.

That may or may not be the case now, as we’ll see below.

Biotech SPBIO, Weekly Chart

Next, we’re going to invert the chart (to mimic inverse LABD) and then label the up-thrust as a Wyckoff ‘Spring’.

Biotech SPBIO, Weekly Inverted

Next, we get closer to the action as shown.

Is the ??? area, a test or a failure of the set-up?

The short answer with about 90-minutes to go before the close, is unknown.

If SPBIO, closes down for the week, painting a red bar, probabilities are to the downside.

Closing higher for the week starts to bring a potential failure of the trade into question.

Summary

No matter what happens, the stop on the short position via LABD is going to be moved to the low of this session; currently LABD 49.90 (not advice, not a recommendation).

We may get into speculation later, on why biotech seems to be the only index in a major squeeze, preparing for downside.

Some who monitor this site, and those ‘awake’, may already have a good idea as to the potential why.

Stay Tuned

Charts by StockCharts

Note:  Posts on this site are for education purposes only.  They provide one firm’s insight on the markets.  Not investment advice.  See additional disclaimer here.

The Danger Point®, trade mark: No. 6,505,279

Biotech … The Big (Short) Test

Price Action Follows The Plan

Biotech index SPBIO, has come back to test the underside of resistance.

Leveraged inverse fund LABD, has performed as expected.

That leaves us at the danger point.

It’s no mystery this site’s coming from a bearish perspective … that we may be about to experience an unprecedented decline.

However, the markets are designed to frustrate all except those in control; the ones implementing the ‘agenda’.

With that, biotech can do any number of things, but the most likely action is a downside reversal from these levels.

Biotech SPBIO, Forecast Update

The previous update linked here identified an ‘accumulation zone’ for inverse fund LABD.

Meaning, we’re expecting biotech to test (temporarily) and in so doing, allow opportunity to ‘accumulate’ the LABD position (not advice, not a recommendation).

The original forecast chart is below:

Biotech 3X Inverse Fund, LABD

Back then

And now.

Pointing to where LABD price action is going to go, could be the equivalent of ‘Porter‘ pointing to the outfield, where he is going to hit his home run; agreed?

The Danger Point

For all the major indices, not just biotech, we really are at the danger point.

The Fed has made its announcement.

Somehow, the mass psychosis continues; that the Fed is obligated to ‘help’ the economy.

Let’s review what the Fed is really all about. That link is here.

One has to wonder, if the typical 30-something (or older) has any idea the above link (and associated book) exists?

Summary

Tomorrow’s price action will let us know if we’ve reached some kind of bottom or if the bottom’s going to fall out.

At this juncture, from a probability standpoint, the trend remains down.

Therefore, remaining short the biotech sector via LABD, LABD-22-03 (not advice, note a recommendation).

Stay Tuned

Charts by StockCharts

Note:  Posts on this site are for education purposes only.  They provide one firm’s insight on the markets.  Not investment advice.  See additional disclaimer here.

The Danger Point®, trade mark: No. 6,505,279

Seabridge Gold … Strategy Update

Lying In Wait … For Opportunity

As the ‘About‘ section says, this site provides one leader’s view on the market; what can best be termed as ‘Strategic Leadership’.

So, just what is that, exactly.

A good example is the current biotech analysis and action.

Biotech strategy, thus far.

No. 1:

Recognize biotech (SPBIO), as bear market leader.

No. 2:

Wait for opportunity to position short via LABD, on an upside reversal; A Wyckoff, up-thrust.

No. 3:

Monitor and increase the short position as the market allows. Continue until targets are met or stopped out (not advice, not a recommendation).

As can be seen, hereherehere, and here, the trade LABD-22-03, is progressing well.

It should be noted, this trade could be over in minutes, or go on for months. The price action itself, will decide when it’s complete (not advice, not a recommendation).

Now, on to gold in general and Seabridge, specifically.

The Gold Reversal

We’ve had several updates that show gold (GLD) has changed hands; from strong to weak.

Quite obviously, this assessment is completely opposite the narrative and the crowd consensus.

However, price action itself, has told us there’s been a reversal.

Recent posts here, here, here, here and here, successively build on themselves showing at this juncture, the gold direction, is down.

Leading Edge Chaos

Evidence continues to build, we’re just on the leading edge of chaos; likely to last for years, if not decades.

Go to time stamp 1:12 at this link and observe one of many efforts already in place to take down the current system.

Chaos, Opportunity, and Seabridge

All of the above brings us to Seabridge Gold (SA).

Going way back, 20-months, to the first post on SA, and taking the following from that report:

“If and when the markets (S&P, Dow, NASDAQ) reverse in earnest, there’s likely to be widespread panic. Just like last time [2007 – 2008] and probably worse.

As a side note: If and when we get there (panic selling), and if SA pushes below well-established support (6-area), the initial plan is to open a major long position … but with a significant caveat.

That caveat is:  We’ll take possession of the actual physical shares (not advice, not a recommendation).  The broker could put up a fuss and charge a fee.  So be it.”

Now, that’s a strategy.

Back then, nearly two years ago, it was not so obvious why having the physical shares was important. I think the reasons for doing so now, are clear.

Let’s move on to the actual chart of SA and look at probabilities.

Seabridge Gold (SA), Quarterly Chart

One thing is obvious just looking at the un-marked chart:

The bull market for SA, ended years ago; October of 2007, to be exact.

The actual price of gold (GLD) went on higher for over three-more years. Yet, SA languished.

Now, gold (GLD) has potentially reversed and there’s possibility for significant downside.

How significant? Well, somewhere in the range of $1,300/oz, or even lower.

Which brings us to the same chart of SA but adding Fibonacci projections.

SA, Quarterly Chart, Fibonacci Projection(s)

Getting closer-in with the zoom, we see the market itself has already validated those projections; especially the 38.2, level.

The 50% projection is near 5.00, and the 61.8%, is all the way down to 0.49 – 0.51.

Seabridge down to 50-cents, is that possible?

The Great Depression, 2.0

Those attempting to equate current events with the Great Depression, are at least doing the good work of recognizing the similarities and possibilities.

In the case of Neil McCoy-Ward, (linked above), he recognizes this time, is a whole other animal.

So, the answer is yes … SA could go to 50-cents. If and when it does, nobody will want to buy.

Stay Tuned

Charts by StockCharts

Note:  Posts on this site are for education purposes only.  They provide one firm’s insight on the markets.  Not investment advice.  See additional disclaimer here.

The Danger Point®, trade mark: No. 6,505,279