‘Off The Cliff’

It’s Official

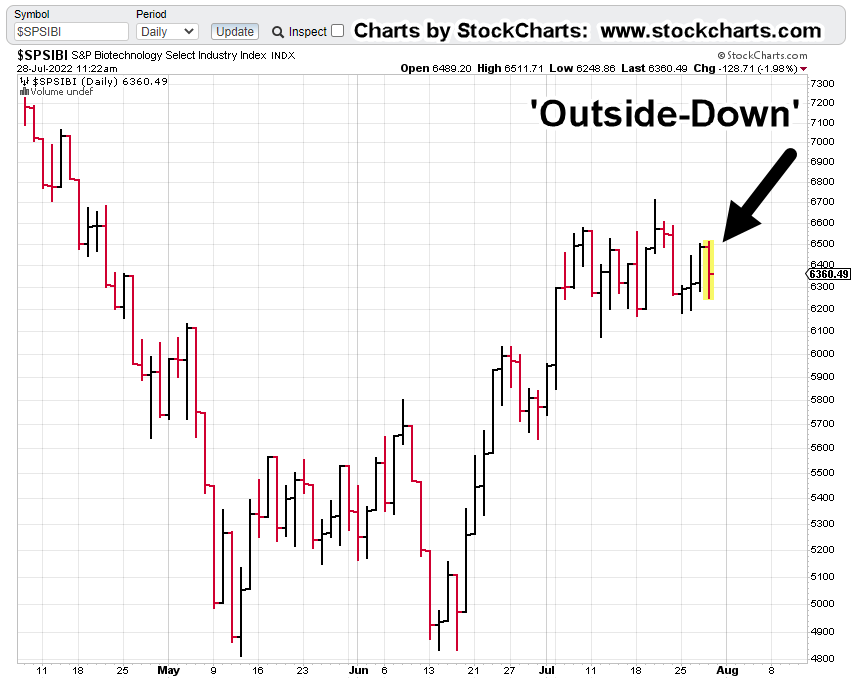
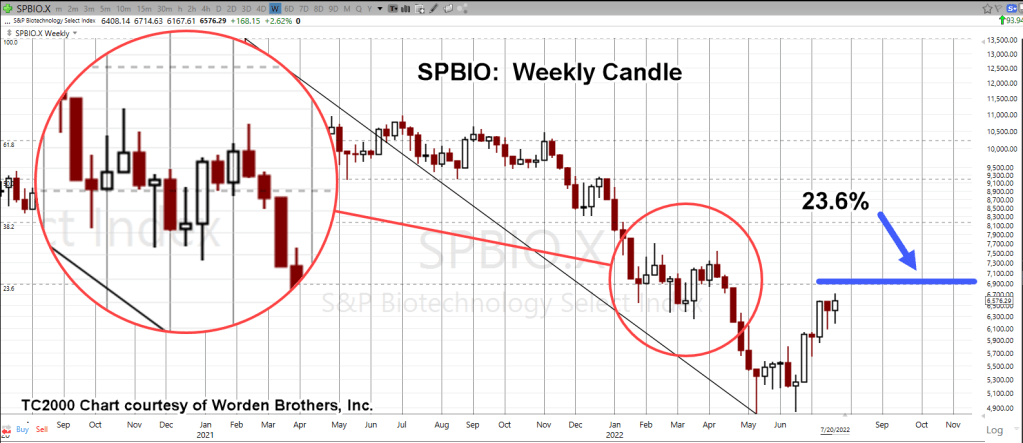
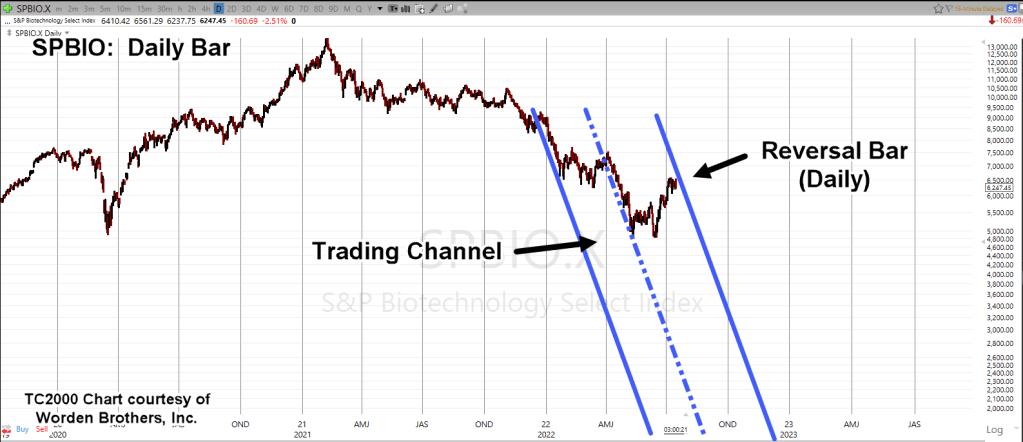
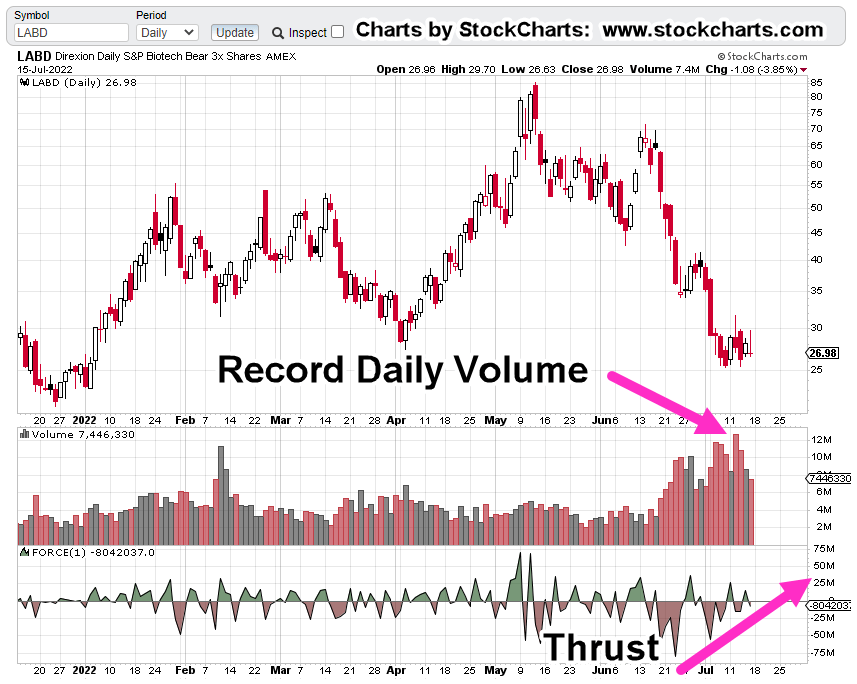
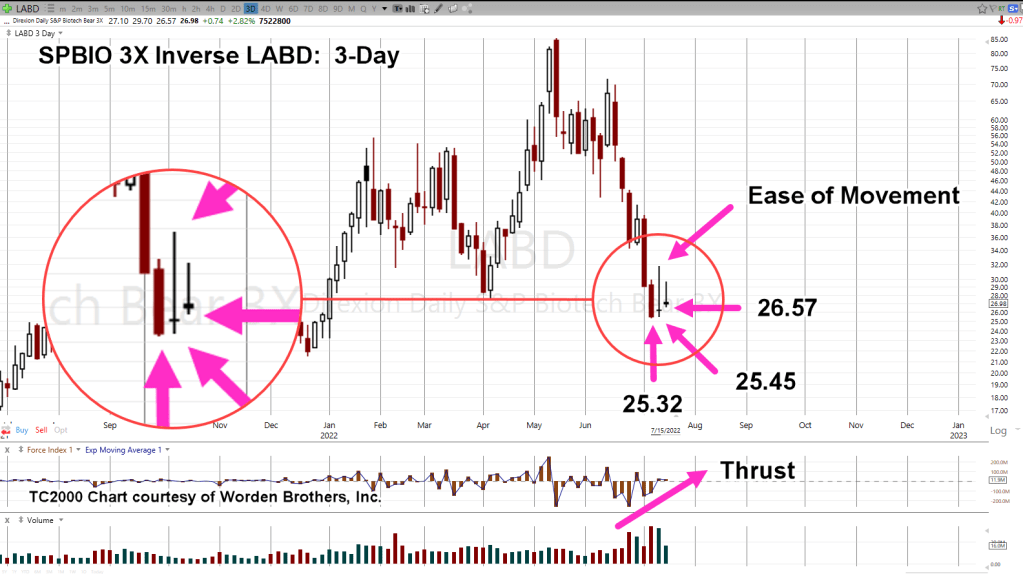
With a new daily low printed for biotech SPBIO, we’ve got confirmation of yesterday’s sell signal (not advice, not a recommendation).

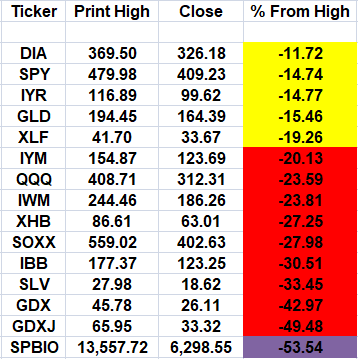
To show that biotech is the weakest of them all, an updated chart (below) has the major indices ranked in order of downside action.

Prices as of 11:12 a.m., EST

Index Table

It’s a no-brainer (almost).

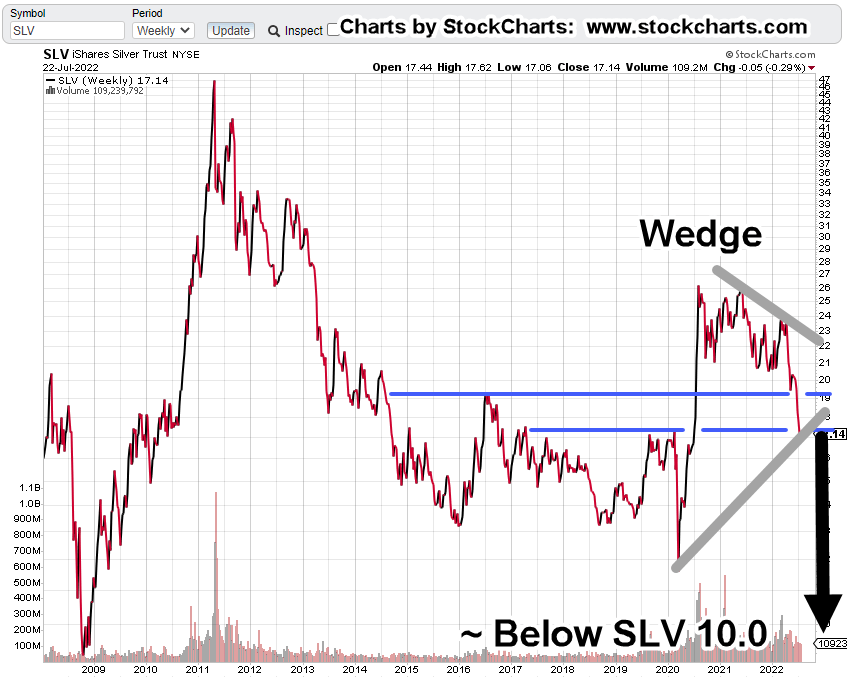
Even with the recent rebound, SPBIO remains the weakest.

From a Wyckoff standpoint, if one is going to short the market, his approach was to select the weakest sector(s) as they’re likely to fall farther, faster.

It’s the complete opposite of the amateur who spends his time trying to pick the top of the highest flyer.

We’re interested in opportunity; not bragging rights.

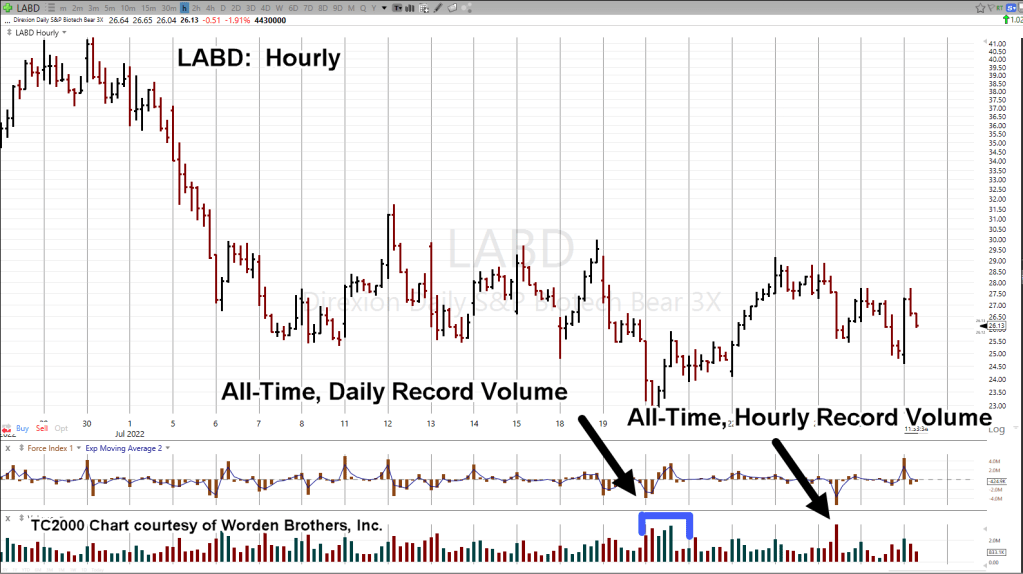
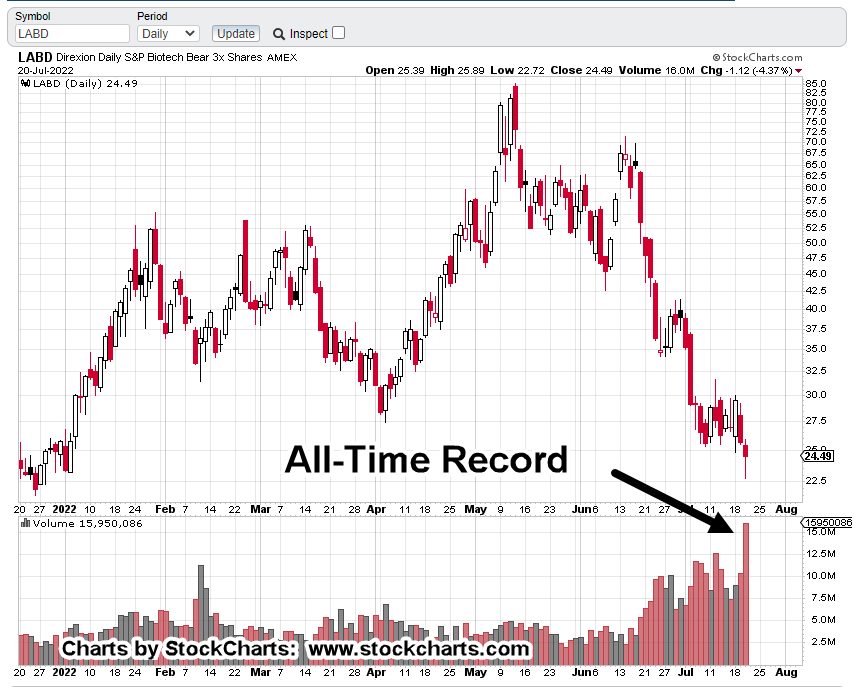
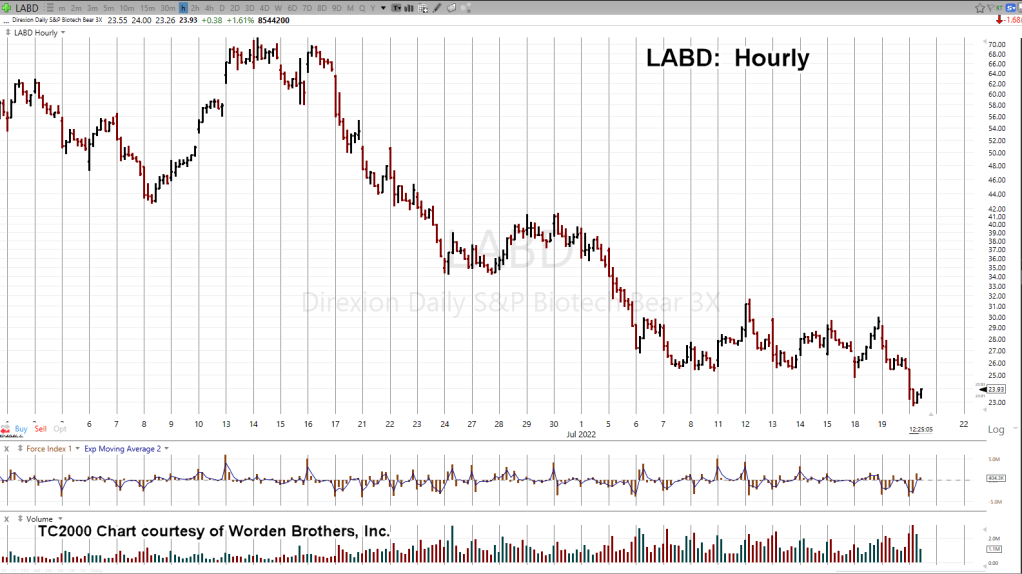
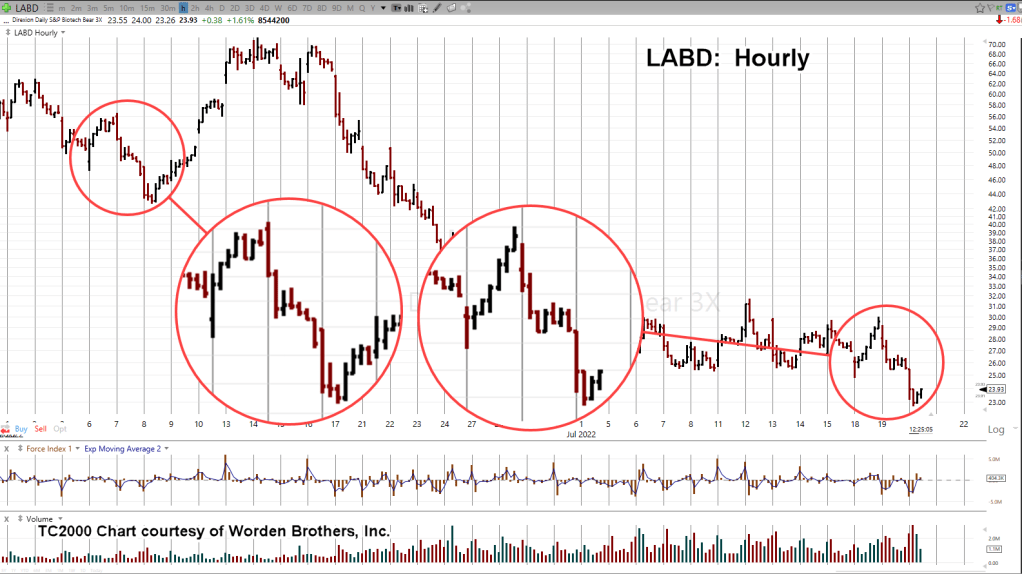
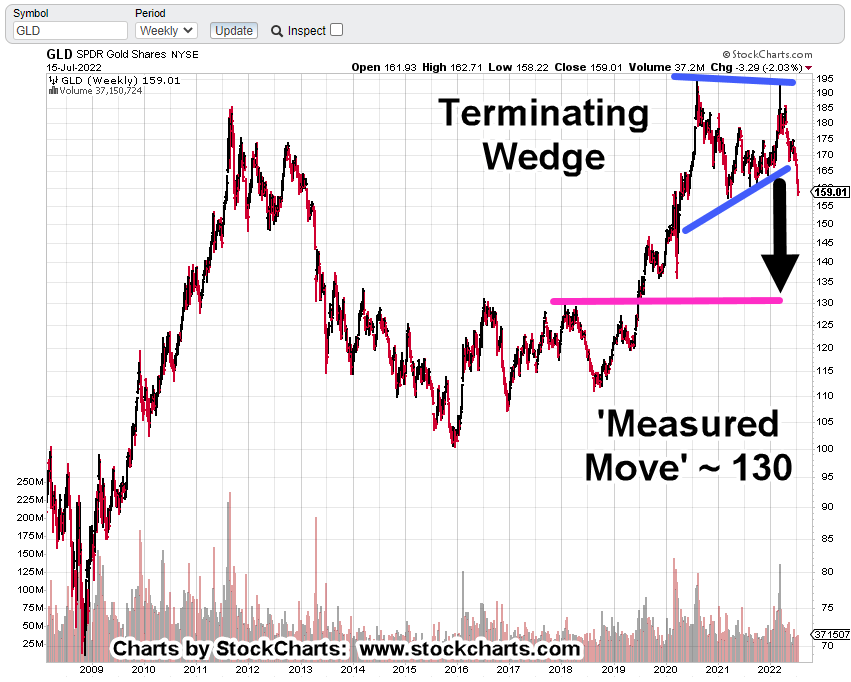
Let’s go straight to the 3X Leveraged Inverse Fund LABD, hourly basis.

SPBIO 3X Leveraged Inverse LABD, Hourly

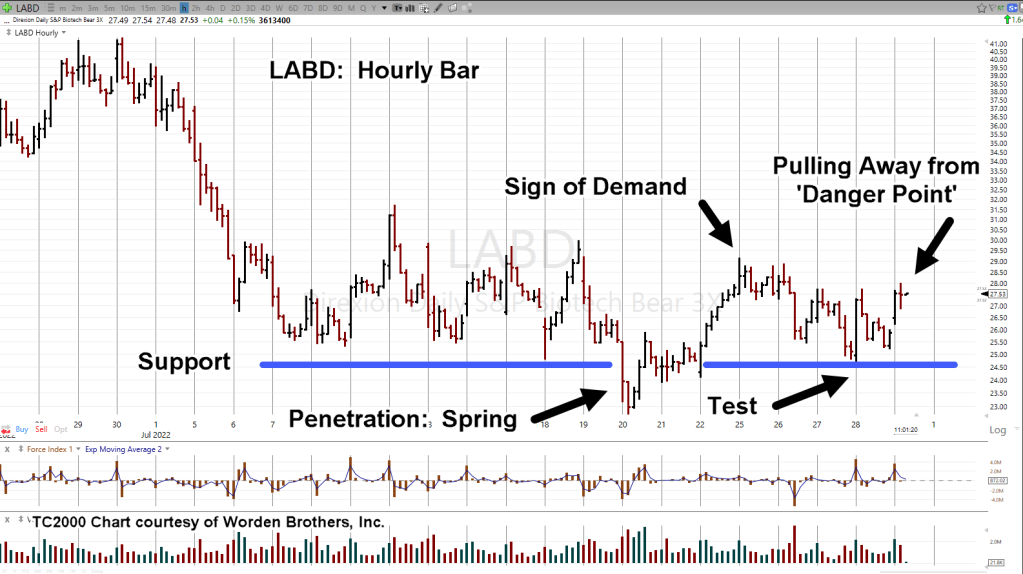
Slowly but surely, LABD is competing the spring set-up and testing action.

If you’re not looking, it’s nearly imperceptible.

However, we’re still at the stage where the test can fail. We’re still at The Danger Point®

A reasonable soft-stop would be today’s low @ LABD 26.21, with a hard stop at yesterday’s low @ LABD 24.60

‘Soft-Stop’ meaning, if it’s hit, probabilities of trade failure have just increased significantly.

Summary

As can be seen on the side-bar, we’re short this sector with LABD-22-05, and TDA-LABD-22-02 (not advice, not a recommendation).

If price action continues to proceed as expected, the next update will show a repeating trendline that’s sure to catch one’s breath.

Stay Tuned

Charts by StockCharts

Note:  Posts on this site are for education purposes only.  They provide one firm’s insight on the markets.  Not investment advice.  See additional disclaimer here.

The Danger Point®, trade mark: No. 6,505,279

When It Heads South …

… Bad News, Comes Out

Is that where we are with Biotech?

Houston Methodist Sued, $25-million

In what may be just the beginning of similar actions, is this the pivot point?

Part of a lawsuit’s process is ‘discovery’. That’s probably the last thing any ‘institution’ wants.

ZeroHedge picked up the news, linked here; the comment section is telling.

Potential for a significant reversal in SPBIO, has been on the radar for about three-weeks.

What’s price action saying at this juncture?

SPBIO, Daily

For starters, within the first hour of today’s session, we’ve already had an ‘outside-down’ print; last session’s highs and lows have been exceeded by today’s action.

Shifting gears for the next chart, we’re looking at 3X Leveraged Inverse Fund LABD.

LABD, Hourly

The Wyckoff spring set-up is clear. The testing discussed in this update, is per-the-book for Wyckoff action.

‘Tests’ can always fail.

That’s why it’s called ‘The Danger Point’. It’s the location where the risk of being wrong is least (not advice, not a recommendation).

The next chart, also LABD, highlights the record volume on two time-frames, daily and hourly.

This is a potential ‘changing of hands’ from weak to strong for the short-side on SPBIO.

It should be noted, last week’s volume for LABD, was also a record, making it three time-frames.

Summary

As this post was being created, LABD continues to rachet lower into what is now a deep test.

Currently trading at LABD 25.98 (mid-session), we’ll see if the test holds and LABD finishes higher for the day.

Meanwhile, the fundamental backdrop and pressure continues to build.

Stay Tuned

Charts by StockCharts

Note:  Posts on this site are for education purposes only.  They provide one firm’s insight on the markets.  Not investment advice.  See additional disclaimer here.

The Danger Point®, trade mark: No. 6,505,279

Biotech, Test-In-Progress

By The Book

With about 40-minutes left in the session, biotech SPBIO, appears to be completing a test of its downside reversal.

Prior updates have shown the potential for a massive trading range; right along with a very weak reversal at Fibonacci 23.6%.

We’ve happened to locate a short video from the Wyckoff Stock Market Institute, detailing the nuances of Wyckoff spring action.

That video is linked here.

Watch the video and then look at the chart of leveraged inverse fund LABD, below.

SPBIO, 3X Leveraged Inverse LABD, Hourly Chart

If the test has competed, we can expect a swift LABD rally (spring) to the upside (down for SPBIO).

Summary

The potential for a significant down-move in SPBIO, has already been covered.

Reference updates linked here, here, and here.

If this is a move of major significance, we’re still in the very early stages.

Positions have already been established; LABD-22-05, TDA-LABD-22-02 (not advice, not a recommendation).

SPBIO itself, will define the next course of action.

Stay Tuned

Charts by StockCharts

Note:  Posts on this site are for education purposes only.  They provide one firm’s insight on the markets.  Not investment advice.  See additional disclaimer here.

The Danger Point®, trade mark: No. 6,505,279

Newmont Mining’s Collapse

Where’s The ‘Inflation’?

As if on cue to support the prior post highlighting silver’s ‘mysterious’ decline, we have this just out, on Newmont Mining.

Newmont’s in free-fall.

For long-time visitors to this site, today’s events should be no surprise.

These reports, here and here, posted back in April, identified reversals in gold miners GDXJ, and implicitly GDX, to the day.

We’ll include a quote from the first linked report below:

“It’s a fairly safe assessment, nobody expects a downside reversal … nobody”.

And yet, here we are.

As the administration and the financial press, becomes ever more confused and bipolar; even now, re-defining the long-held definition of ‘recession’, we have Wyckoff analysis time and again, cutting through the media trash to determine the highest probability for the market.

Newmont Mining (NEM) Weekly

The chart below has current conditions for Newmont.

Also shown is the location of the first post linked above, released before Newmont began its decline.

At this juncture, NEM has penetrated long established support; technically it’s in ‘spring position’.

The expectation is for some kind of (weak) rally attempt. We’ll see if it’s able to get back above support.

Stay Tuned

Charts by StockCharts

Note:  Posts on this site are for education purposes only.  They provide one firm’s insight on the markets.  Not investment advice.  See additional disclaimer here.

The Danger Point®, trade mark: No. 6,505,279

Silver’s ‘Mysterious’ Decline

Read The Chart

Media analysts and YouTubers alike, are scratching their collective coneheads.

They’re asking; why is silver down a whopping – 39%, from its print high of February 1st, this year?

If we factor in the high of SLV 48.35 (from April of 2011), silver’s been pummeled – 65%.

With the ‘rampant’ inflation and never-ending money printing, silver (along with gold) should, there’s that word ‘should’, be skyrocketing higher.

It’s an apparent mystery; steeped with smoke-filled back rooms and intrigue.

The ‘Inflation’ Narrative

Let’s help unravel silver’s decline by taking a look at some of the facts.

First up, is ‘inflation’.

The inflation narrative is false. There; glad we got that out of the way. 🙂

How do we know?

We know it’s false because the price action itself, tells us it’s false.

It’s obvious at this point, what we have is supply destruction and not inflation.

The Economic ‘Connection’

Next up, is the economy.

Silver along with copper are industrial metals. They follow the economy … more so with copper. Copper futures are down – 32.5%, from their March 7th, highs.

Coper’s industrial uses are linked here. Nearly half of copper production is for building and construction.

Since the largest real estate bubble in world history has just popped, copper demand is essentially going to collapse.

If at this early stage of Great Depression 2.0, the average person can’t pay the phone bill, where are they going to get any money to drive precious metals demand higher?

Moving on to ‘truth’, we have price action.

Silver SLV, Weekly Close

The chart below has SLV, penetrating one support level (upper blue line) and just now, at the next support.

Since gold (GLD) is in position for an upward test of its wedge breakdown (chart not shown), it’s reasonable to expect another bounce off support for silver.

Using the ‘rule of alternation’, we already had a brief move off the first support level before reversing.

The next contact at lower support, will likely bounce for longer or not at all.

If silver can’t go higher … look out below.

Silver SLV, To Single Digits?

The economic depression is just getting started and industrial metals demand is already collapsing.

Although a data point of one, the following is significant.

Supporting the ‘depression’ assessment is this link; specifically, time stamp 3:20, with a recent graph of housing listings in California … going vertical.

SLV, is in position to test higher; thus, confirming the wedge pattern (grey lines) shown below.

Added to that pattern is a measured move target should SLV, break down to lower levels after an upward test.

There it is: ‘Mystery’ solved.

Silver is heading lower because price action said it would.

Now, the fundamentals are kicking in to add a potential mass acceleration to the decline.

Stay Tuned

Charts by StockCharts

Note:  Posts on this site are for education purposes only.  They provide one firm’s insight on the markets.  Not investment advice.  See additional disclaimer here.

The Danger Point®, trade mark: No. 6,505,279

Biotech: Before The Open

Last Session’s Record Volume

Depending on today’s action, yesterday may have been a ‘changing of hands’ for biotech; specifically, the leveraged inverse fund LABD.

We’ll start first with the longer time frame; the weekly, to show that SPBIO is at or near a Fibonacci 23.6% retrace.

Biotech SPBIO, Weekly

Looking just to the left of the right-side action we see a significant congestion area that’s highlighted below.

Note how price action has oscillated around that area.

It’s about three-months at this level before breaking lower and now, coming back to test.

The resistance is significant.

Next, is the inverse fund’s daily chart and the record volume.

SPBIO Leveraged Inverse LABD, Daily

Depending on today’s action, this is a potential ‘changing of hands’ from weak to strong.

We saw that such volume in the gold market (GLD) was indeed an infection point.

Concerning gold (GLD), back on March 20th, the report linked here, had this to say:

“From a Wyckoff, tape-reading approach, we have to trust what the chart is telling us.

That is, gold has reversed.”

How true that was. GLD never looked back and is now down around – 18%, from its highs.

The same could be happening for biotech.

Stay Tuned

Charts by StockCharts

Note:  Posts on this site are for education purposes only.  They provide one firm’s insight on the markets.  Not investment advice.  See additional disclaimer here.

The Danger Point®, trade mark: No. 6,505,279

Biotech … Good News, Bad News

Reversal, Finally Here

The good news for the bears and the shorts; this morning’s action was probably the final push higher for biotech SPBIO.

The bad news; if that’s the case (a reversal) and the right-side trend-line has been verified, it could be the very beginning stages of a massive collapse.

It’s about midway through the day’s session. The leveraged inverse fund LABD, is printing a repeating characteristic that identifies a reversal.

Biotech SPBIO 3X Leveraged Inverse LABD, Hourly

This is how it looks around 12:50 p.m., EST with no mark-up.

Next, we’re going to zoom in on two areas of interest. A previous reversal and the apparent reversal in progress.

The price action is near identical.

First a false reversal that’s followed by the real one. That’s where we are now with today’s action.

Summary

A follow-up post using the weekly time frame is due out before the session open tomorrow.

All short positions remain active (not advice, not a recommendation).

Stay Tuned

Charts by StockCharts

Note:  Posts on this site are for education purposes only.  They provide one firm’s insight on the markets.  Not investment advice.  See additional disclaimer here.

The Danger Point®, trade mark: No. 6,505,279

Biotech’s Liquidation Sale

Won’t Know For Sure, Until It Hits Bottom

Watching and waiting for the downside reversal; looks like it’s here.

With about thirty-minutes left in the session, biotech SPBIO, is printing a reversal bar.

It’s not just the reversal that’s important but we could also be on the right edge of a massive trading channel.

Biotech SPBIO, Daily

It’s hard to see what’s really going on until we compress the channel and look at the possibility.

It doesn’t seem real.

However, we all have to realize we’re in uncharted (literally) territory.

If this sector begins a significant decline, that’s when to expect “bad news” coming out in the mainstream … likely to accelerate the downdraft.

Positioning

The short position in FXI (via YANG) was closed out (TDA-YANG-22-01) at 10.64, with a 15.4%, gain.

A new position was opened in LABD @ 25.80, as LABD was reversing off the session lows (not advice not a recommendation).

Trade identified as TDA-LABD-22-02.

The original LABD-22-05, was maintained, still active.

Stay Tuned

Charts by StockCharts

Note:  Posts on this site are for education purposes only.  They provide one firm’s insight on the markets.  Not investment advice.  See additional disclaimer here.

The Danger Point®, trade mark: No. 6,505,279

Positions & Plans

Expectations, For The Week Ahead

Summarizing trading actions for the week and the action plan, going forward.

Open Positions:

Currently there are two open positions: details below.

TDA-YANG-22-01

Short the Chinese FXI via YANG (not advice, not a recommendation)

Enter YANG @ 10.95, with current stop @ 10.89

Friday’s close @ 14.05, Open profit = 28.3%

FXI, 3X Leveraged Inverse, YANG, Daily

Shown above, YANG appears to be in a trading channel (grey lines).

As a result of moving decisively higher (FXI, lower), the stop on the position is to be moved to YANG 12.79 (not advice, not a recommendation) at the next trading session.

LABD-22-05

Short the biotech SPBIO via LABD (not advice, not a recommendation)

Multi-entry LABD @ 28.11 (combined), with current stop @ 26.57

Friday’s close @ 26.98, Open loss = – 4.02%

SPBIO, 3X Leveraged Inverse, LABD, Daily

Last week contained both record daily volume (since inception) for LABD, as well as record weekly volume.

Downward thrust energy has dissipated. The down-move appears to be exhausted.

Supporting the assessment LABD is at or near a pivot point (reverse higher), we’re going to review the 3-Day chart.

SPBIO, 3X Leveraged Inverse LABD, 3-Day

Note, there is one more trading session (this Monday) needed to complete the current ‘3-Day’ bar.

First, we can see downward thrust dissipating as on the daily chart.

The prior three-day bar is identified as ‘Ease of Movement’.

It’s the first bar in the entire down-sequence starting on 6/14, where upside action was able to penetrate the prior (3-Day) bar’s high.

That’s an indication of demand.

After upside penetration, price continued lower.

However, here’s the important part, LABD, closed higher and posted a higher low when compared to the prior 3-Day bar; subtle clues a reversal may be in the works.

There’s one more trading session needed to complete the current 3-Day bar and anything can happen.

However, based on the analysis thus far, it’s reasonable to expect LABD, to continue to post higher; that we’ve reached the extreme of downside action.

The 3-Day below shows the higher lows and includes a zoom of the area.

Adding to the reversal case, on a weekly close basis, SPBIO reached underside resistance during the week of 7/8. This week just past, it closed slightly lower (chart not shown).

Summary

It’s the weekend and so we have the usual suspects of bad news … any of which could be the butterfly in the amazon, the final upset for the markets.

Just a brief list of current events, below:

Texas cattle being dumped on the market

Locomotive workers may go on strike

Child size coffins ordered in bulk.

Stay Tuned

Charts by StockCharts

Note:  Posts on this site are for education purposes only.  They provide one firm’s insight on the markets.  Not investment advice.  See additional disclaimer here.

The Danger Point®, trade mark: No. 6,505,279