Supply & Demand … Junior Miners

Testing The Right-Side

It’s a good thing we’re not listening to the ‘inflation’ narrative, just like we didn’t listen to ‘The Speck’ narrative of the past few years.

Turns out, ‘The Speck‘ was just the re-branded, common flu.

Inflation or Deflation

One has to wonder if the mainstream will ever acknowledge we’re in a deflation impulse.

The ‘inflation’ we’re seeing is (potentially) more associated with supply, product, and population destruction than any ‘money printing’ (not advice, not a recommendation).

As ‘Winston’ says at this link (time stamp (1:21:48),

People are allergic to the truth.’

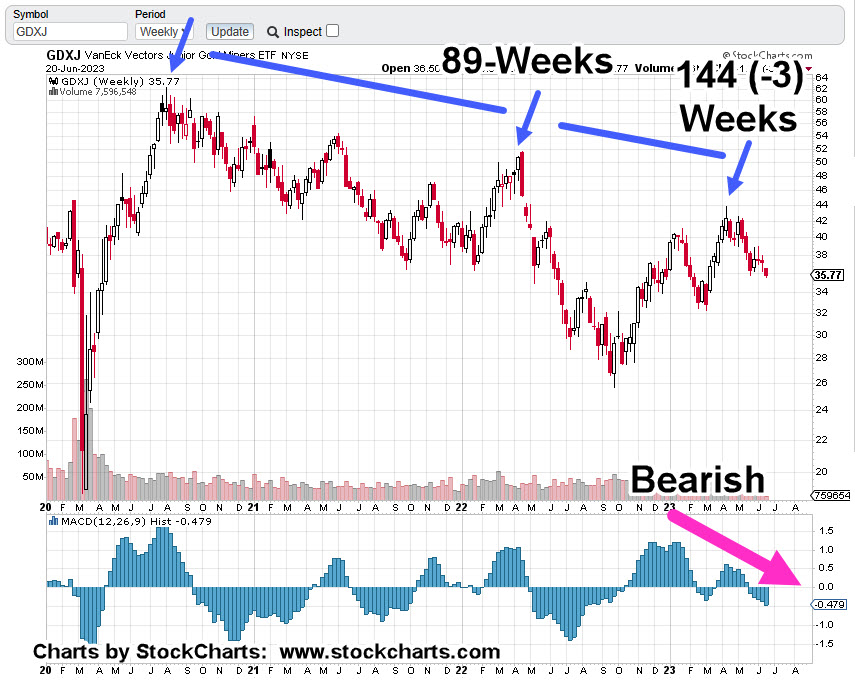
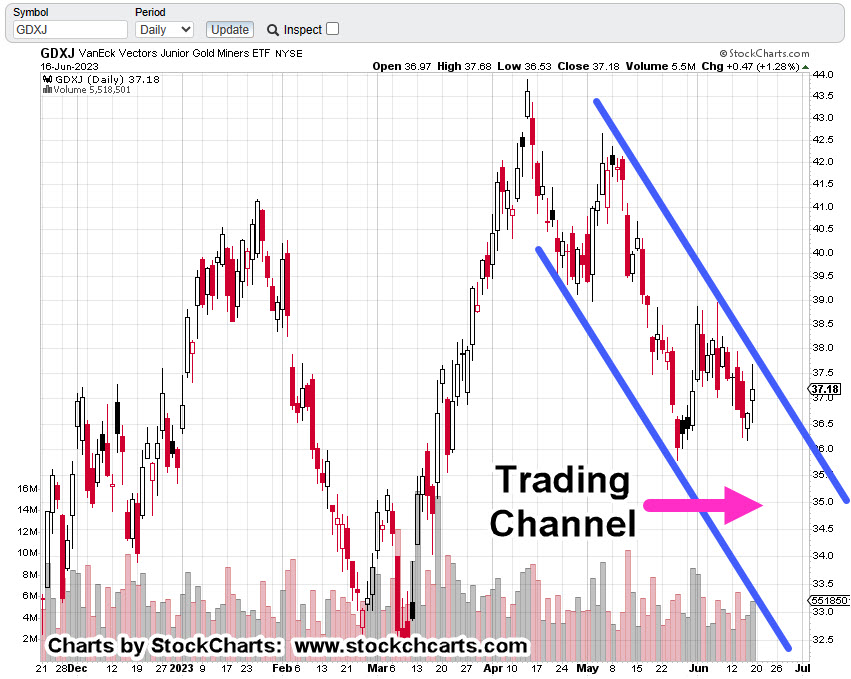
The truth for the day, concerning the Junior Mining Index GDXJ, is that we’re testing the right-side trend line, the supply side.

Junior Miners GDXJ, Daily Candle

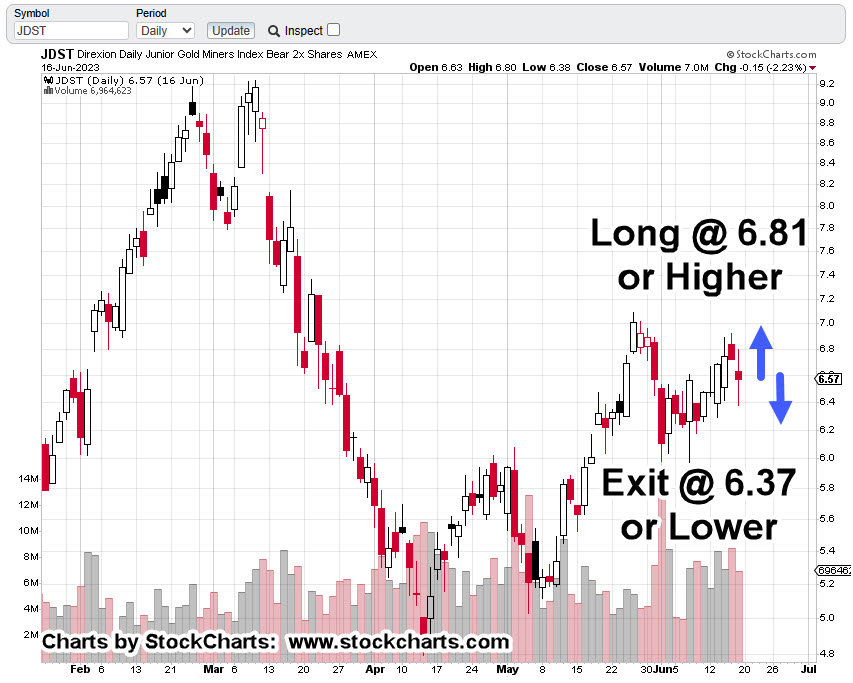
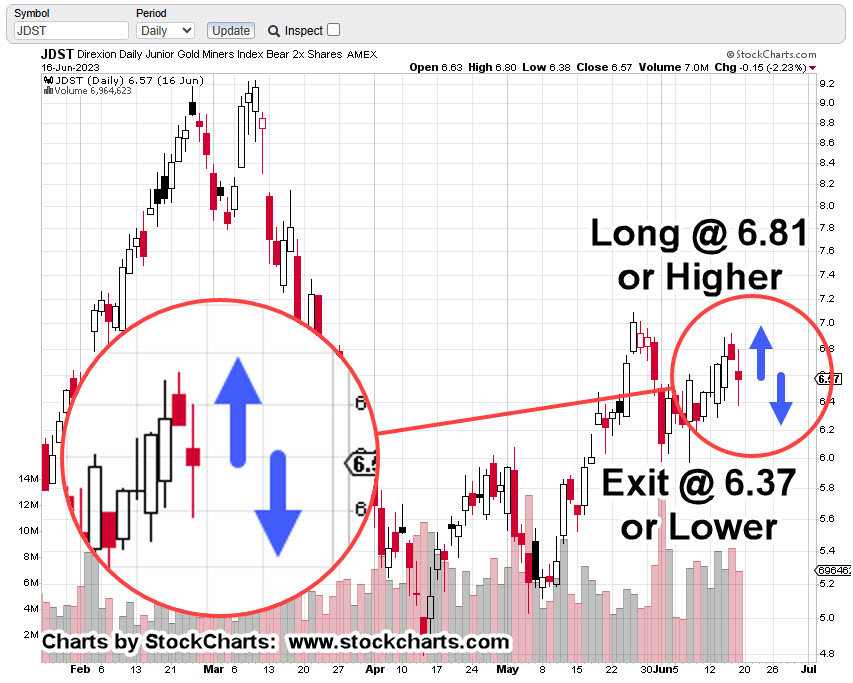
Today’s price action is technically a ‘Key reversal’.

As such, the typical response is continuation to the upside during the coming days and or weeks.

Key reversals are not perfect and at times, will fail.

The important session for GDXJ, is tomorrow, Friday.

Continued upside most likely results in exit of short positions (not advice, not a recommendation).

Stay Tuned

Charts by StockCharts

Note:  Posts on this site are for education purposes only.  They provide one firm’s insight on the markets.  Not investment advice.  See additional disclaimer here.

The Danger Point®, trade mark: No. 6,505,279

CarMax (Crash) Clues

Hits ‘Target’, Then Reversal

Sales down, earnings down, car prices down, demand collapsing and yet, KMX, goes higher.

Frist off, let’s address the ‘clown show’ that bandies about ‘crash’ this, and ‘crash’ that … ad infinitum.

After you’ve said crash fifteen, thirty times or more on your YouTube channel, nobody’s listening when it really happens.

How about we all (myself included) take a cue from the late Dr. Martin Zweig as seen here, (time stamp 6:40) where he’s reluctant to say ‘crash’ even when it’s on the eve of Black Monday 1987.

Now, back to our update.

CarMax … Strategy

So, let’s review the CarMax situation from a calm but focused perspective.

Strategically, KMX has met the price target identified last October (link here), and has apparently reversed.

The ‘Dead Cat’ Has Bounced

So, was last Friday’s earnings release high of 87.06, close enough to the ’85-area’ as forecasted?

As the magenta arrow shows, there could be small blip up to resistance in the 85-area before potentially rolling over into a descent that projects to the 4.00, level.”

It took over eight months to get back to the ’85-level’.

What happens next?

Fundamental Forces

It’s been the premise of this site, we’re at the beginning stages of the largest financial, social, and population collapse ever seen (not advice, not a recommendation).

From a CarMax perspective, we have this just out yesterday.

Car lots are overflowing and we’re playing musical chairs with inventory to make it look like something’s happening.

Next, we have a Ford employee writing in, to Jeremiah Babe, saying the Electrical Vehicle Plant is a “ghost town”.

What does that ‘clean energy’ ghost town mean for silver demand? Ah, but I digress. 🙂

We’re most likely just getting started. For a snapshot into what may come our way, take a look at this.

Now, on to the chart

CarMax (KMX) Quarterly Bar

The original chart from October 2022, is repeated below.

Now, the update.

CarMax, KMX, Daily Bar

When looking at the daily, we see we’re in Wyckoff Up-Thrust (reversal) condition.

We’re at The Danger Point®

Just so we’re not one-sided, here’s a bullish forecast for KMX (not advice, not a recommendation).

At this juncture, there’re no plans to go short (not advice, not a recommendation) … although it may not be a bad spot considering all the forces lining up.

An obvious stop level (for a short) would be last Friday’s high of KMX 87.06 (not advice, not a recommendation).

Stay Tuned

Charts by StockCharts

Note:  Posts on this site are for education purposes only.  They provide one firm’s insight on the markets.  Not investment advice.  See additional disclaimer here.

The Danger Point®, trade mark: No. 6,505,279

Mind The (Miner) Gap

‘Straightforward’ … Sort Of

‘Real (market) opportunities are rare. When one is found, it must be used to its fullest extent’; Gerald M. Loeb, the late, and former Vice Chairman, of E.F. Hutton

What a refreshing quote that is, back in the day when we had ‘Chairmen.’.

So, are the Miners the Juniors GDXJ, that opportunity?

From a technical standpoint, there’s the bearish divergence on MACD when looking at the weekly. Then, we have Fibonacci correlation on the weekly as well (shown below).

The daily has the short entry signal given yesterday (not advice, not a recommendation).

Fundamentals Collapse

Next, we have industrial demand in collapse, not to mention the world economies. If industrial demand is collapsing for photovoltaic components (link here), then silver demand must be collapsing.

The ‘Gap’

The analysis was working fine in the pre-market for shorting the GDXJ (not advice, not a recommendation), but then at the open, there was the gap.

Let’s address that but first get started with the weekly chart of GDXJ

Junior Miners, GDXJ, Weekly

The technical details are clear: Bearish divergence on MACD as well as Fibonacci time correlation.

The original Fibonacci 89-weeks was covered in this post.

Yesterday, there was a gap-lower open and price action kept posting lower.

Will this gap be filled? That’s the question.

Junior Miners GDXJ, Daily

As the chart implies, was yesterday a breakaway gap?

Price action’s right at support … or slightly below, which technically put us in Wyckoff ‘spring’ position.

The ‘Probabilities’

Given the bearish overall condition of this sector both on a technical and fundamental basis, a gap-fill is unlikely … but one has to be prepared.

As stated in the last update, the short position via leveraged inverse JDST was increased (not advice, not a recommendation).

To account for possible gap closure on the inverse JDST, a soft stop (trader discretion) is at 6.80 and below, with an absolute hard stop (no excuses exit) at 6.38 (not advice, not a recommendation).

It’s now, 20-minutes before the open.

Let’s see what happens next.

Stay Tuned

Charts by StockCharts

Note:  Posts on this site are for education purposes only.  They provide one firm’s insight on the markets.  Not investment advice.  See additional disclaimer here.

The Danger Point®, trade mark: No. 6,505,279

Entry Signal(s) … Short The Miners

Classic, Textbook

It’s rare to get a ‘textbook’ signal … but every now and then, it does happen.

The last update on the Junior Miners, GDXJ, said a short position in the sector was re-established.

Today’s trading action may be straightforward; we either get stopped-out, or the market gives the signal to enter a full (sized) position (not advice, not a recommendation).

The bearish case for the miners has already been established many times over. Recent posts are here, here, here and here.

Since we’re looking at the sector from the short side, we’ll use the chart for the leveraged inverse fund JDST.

Junior Miners, Leveraged Inverse JDST, Daily

As said at the top, it’s (potentially) straightforward.

If JDST, price action exceeds 6.81, a full position will be entered with hard stop at this session’s low (determined at the close of the day).

If price action declines to 6.37, or lower, the existing (small) position is closed out.

Closer in, with a zoom of the price action.

As of this post (8:41 a.m., EST) JDST is trading in the pre-market slightly higher at, 6.65 which is + 0.08, or + 1.22%.

Stay Tuned

Charts by StockCharts

Note:  Posts on this site are for education purposes only.  They provide one firm’s insight on the markets.  Not investment advice.  See additional disclaimer here.

The Danger Point®, trade mark: No. 6,505,279

Trading Channel Update, GDXJ

Price Action Itself, Defines The Levels

It’s time for an ‘adjustment’ to the trading channel identified in the prior update.

The Juniors GDXJ, are still in a downtrend.

Last Friday, they hit and retraced from the (adjusted) right side trading channel shown below.

The weekly MACD histogram (not shown) remains in a bearish divergence, indicating probabilities still favor the downside.

Price action will have to decisively break the downtrend to negate the bearish potential.

Junior Miners GDXJ, Daily Candle

From a trading perspective, existing short positions were closed out this past Friday and then re-established (partially) towards the end of the session (not advice, not a recommendation).

Dollar Death … Not Yet

Just like the A.I. propaganda, it’s popular to get hysterical about ‘de-dollarization’.

Two perspectives that are not part of the crowd are here and here.

They give a more sober look at what is really happening on a world-wide, dollar basis.

Stay Tuned

Charts by StockCharts

Note:  Posts on this site are for education purposes only.  They provide one firm’s insight on the markets.  Not investment advice.  See additional disclaimer here.

The Danger Point®, trade mark: No. 6,505,279

The ‘SOXX’ Top

Was That, ‘THE’ Top ?

Beginning at time stamp 6:24, at this link, The Maverick goes through an investigation into NVDA, projections.

‘Something doesn’t add up here ….’

That report was three weeks ago. What’s happened, lately?

As of the close this past Friday, NVDA, the largest in the SOXX, was at $1.1-Trillion, market cap. A distant second, is Taiwan Semi (TSM) at $545.5-Bln.

Below, we have a confluence of events for the SOXX.

Semiconductor (ETF), SOXX, Weekly Candle

We’re at the top of a trading channel.

We’re in Wyckoff ‘Up-Thrust’ (reversal) position.

A lot of volume expended with less (net) upward progress than previous volume spike; ‘effort vs. reward’.

Getting down to the daily, we see a terminating wedge that’s coupled with reduced volume.

Semiconductor Index SOXX, Daily Candle

So, what does that mean?

The ‘probabilities’ for more upside are, or have been, reduced significantly (not advice, not a recommendation).

Stay Tuned

Charts by StockCharts

Note:  Posts on this site are for education purposes only.  They provide one firm’s insight on the markets.  Not investment advice.  See additional disclaimer here.

The Danger Point®, trade mark: No. 6,505,279

Key Reversal … Yet Again

Junior Miners Take Another Hit

With today’s outside-down (as of 2:43 p.m., EST), that makes it two key reversals for GDXJ, in the past five trading days.

While it looks like the whole herd is focused on the new mania, Artificial Intelligence, back at the ranch, the miners are painting an ominous picture.

Rendezvous With Destiny

The first two-minutes and ten seconds, at this link, are all that’s needed to get the idea of what’s likely to come.

The market recovered (fairly quickly) from 1987 … this time, may indeed be different.

The Elephant Sleeps

Ah, yes. The elephant no one talks about … or more accurately, are afraid to talk about.

Three links here, here and here, show us the elephant may be about to awake.

Even Fox News admits, it was all a lie.

Junior Miners GDXJ, Trend & Channel

From the bottom, May 25th to now, is a Fibonacci 13-Days.

Is that important?

Here’s a prior analysis on Real Estate IYR, that shows how Fibonacci can identify the pivot point, trend and/or trading channel.

Now, back to the Juniors.

The mining sector appears to be under pressure. Each attempt to rally is being thwarted.

Compressed view of the channel, below.

The Fed announcement at 2:00 p.m., EST tomorrow, may or may not have any material effect. The sector may just continue lower …. slowly, without much fanfare (not advice, not a recommendation).

Stay Tuned

Charts by StockCharts

Note:  Posts on this site are for education purposes only.  They provide one firm’s insight on the markets.  Not investment advice.  See additional disclaimer here.

The Danger Point®, trade mark: No. 6,505,279

Gold Miners … Stealth Reversal

Narrow Open & Close Price Action

If you’re not looking for it … you’ll miss it.

Early in today’s session, the Junior Miners GDXJ, posted a new daily low and new weekly low. That helps the downside probabilities (not advice, not a recommendation).

As mentioned in the prior update, when price action penetrates existing lows, there’s a good chance of ‘spring’ action as a result. The market attempts to rally.

Sometimes it’s successful; other times, not.

The attempt to rally after posting new lows is what GDXJ is doing now (as of 2:15 p.m., EST).

Junior Gold Miners GDXJ, Weekly Bar

In the weekly chart below, note how the close, then open, then close and then open again, are to each other.

That ‘narrowness’ signifies either resistance or support, in this case, resistance.

Where the sector closes for the day may an important clue if we’ll continue to the downside.

Next update, the trend-lines.

Stay Tuned

Charts by StockCharts

Note:  Posts on this site are for education purposes only.  They provide one firm’s insight on the markets.  Not investment advice.  See additional disclaimer here.

The Danger Point®, trade mark: No. 6,505,279

Tesla Nears (Short) Target

Will It Get To 266 ?

Let’s go back to the last update on Tesla (TSLA), and see how that analysis is working out:

“Unless we reverse right here and now, Fibonacci retrace and projections (shown below) target the $260 – level for TSLA.”

That was back in early March.

Now, TLSA is currently trading (as of 11:30 a.m., EST) at 246.71, and pushing higher.

The original chart of TSLA, from the March 5th, update is below, followed by current activity.

Tesla TSLA, Daily

Original analysis.

Updated chart (11:15 a.m., EST):

From a trading perspective, TSLA, is being used as a proxy for the market.

That means, if there’s to be a reversal at or near the 259-area, it’s likely the overall market will reverse as well (not advice, not a recommendation).

The ‘Ponzi’ has already been established (the last update). We see the delusion continues with reports like this.

Stay Tuned

Charts by StockCharts

Note:  Posts on this site are for education purposes only.  They provide one firm’s insight on the markets.  Not investment advice.  See additional disclaimer here.

The Danger Point®, trade mark: No. 6,505,279

Key Reversal … Gold Miners

New Daily Lows

We’re now about mid-way into the session.

The daily lows of the past four trading days have been penetrated: thus, defining today as a ‘key reversal’ or ‘outside-down’.

Spring Position

Ironically, since those lows have been penetrated, it sets up the GDXJ, in Wyckoff ‘Spring’ position.

There’s a possibility of some type of rising action as we get near the close … but don’t count on it (not advice, not a recommendation).

The weekly MACD, is in a bearish divergence (not shown) and it looks like the daily upside testing is complete.

This bearish set up may continue to develop into a significant downside move or just as easily, dissipate into randomness.

Junior Miners GDXJ, Daily Candle

If this turns out to be an important directional move, we’re still early (not advice, not a recommendation).

Following updates will present trendlines and support/resistance areas.

Stay Tuned

Charts by StockCharts

Note:  Posts on this site are for education purposes only.  They provide one firm’s insight on the markets.  Not investment advice.  See additional disclaimer here.

The Danger Point®, trade mark: No. 6,505,279