Biotech … Stall & Reverse

Heading Off The Cliff ?

We’re about to find out.

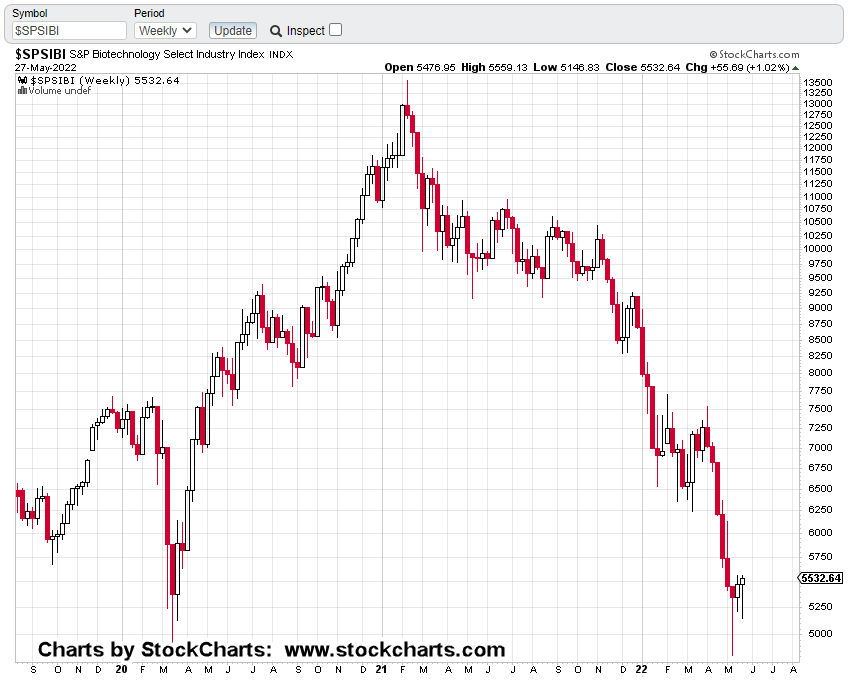
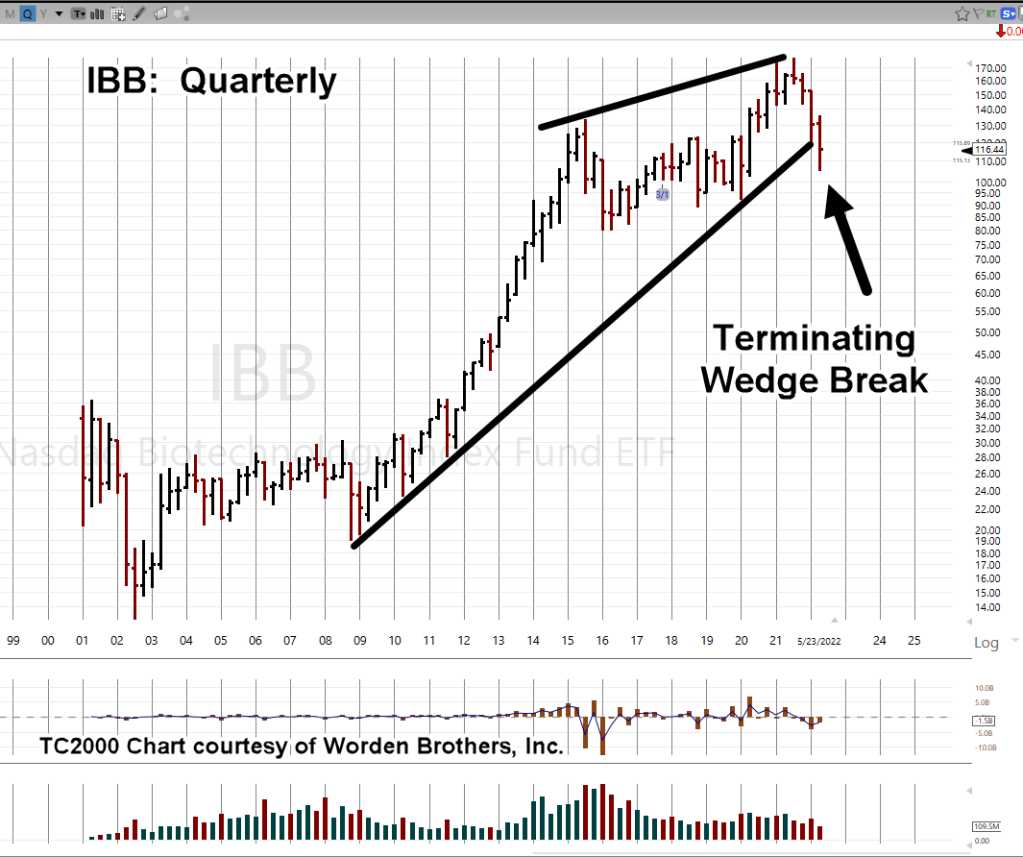
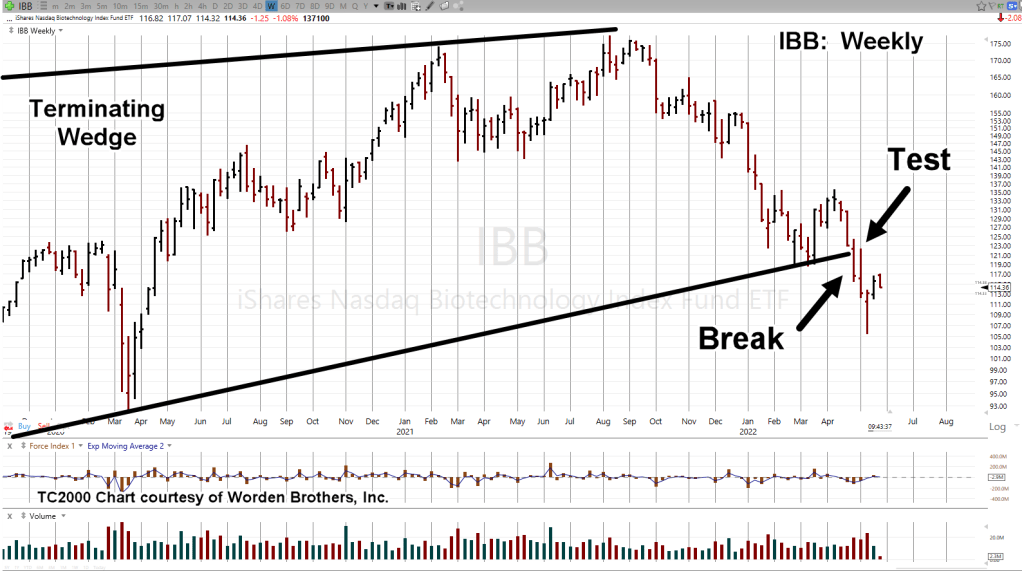
The last update presented that whatever happens with biotech (SPBIO), it’s likely to be decided quickly.

That conclusion was based on the ‘rule of alternation’ and the fact, the whole short squeeze event from last week, did not result in a new weekly high.

That, Was Then

What we have now so far in today’s session, is an attempt to move higher by SPBIO, which appears to have stalled and now, looking to reverse.

The reversal part won’t be confirmed unless, and until a new daily low is posted.

For today, posting a new low is somewhat of a tall order because of Friday’s wide trading range … but we’ll see.

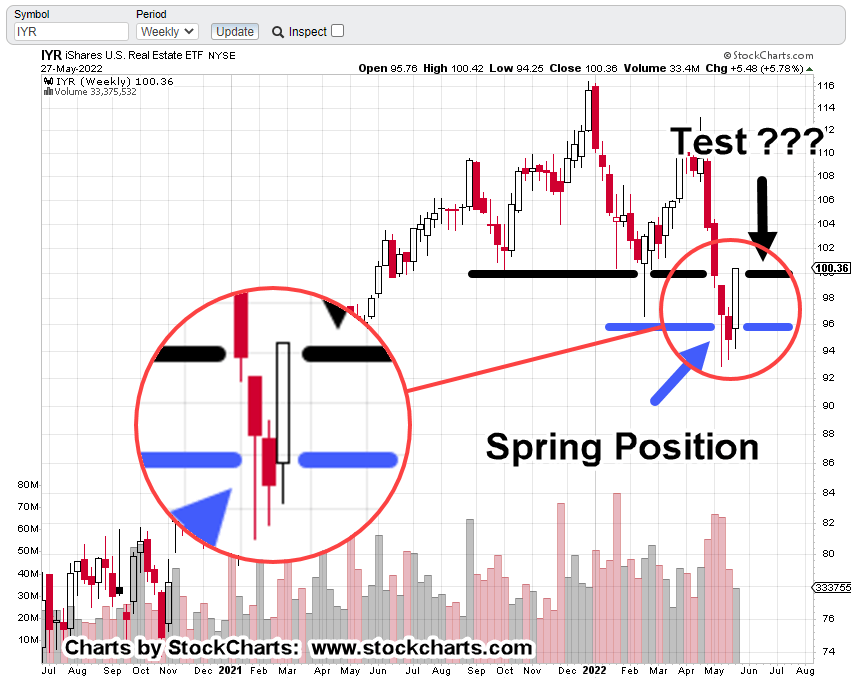
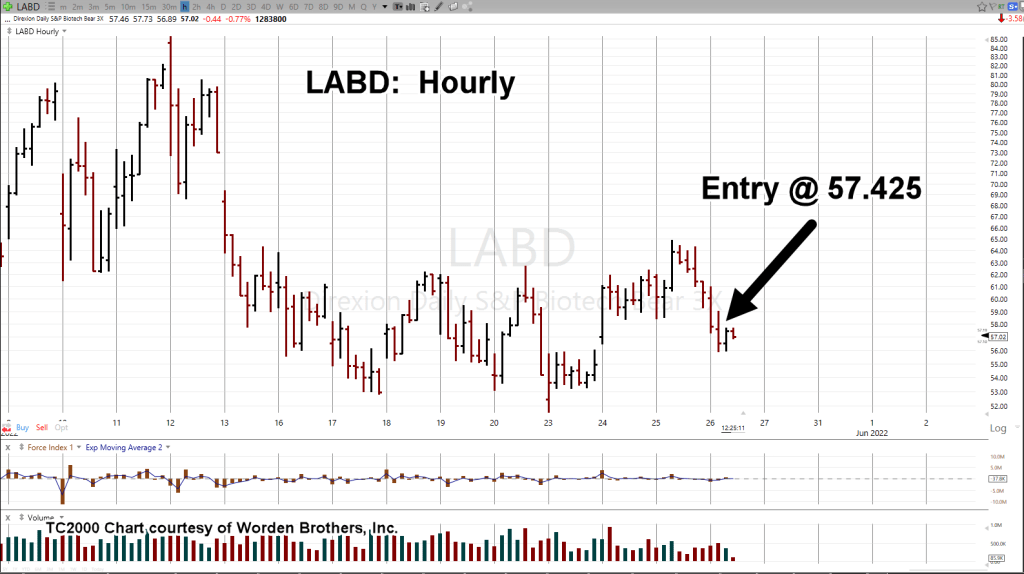
Instead of going to the actual index, SPBIO, we’ll look at the 3X leveraged inverse fund LABD

SPBIO, 3X, Leveraged Inverse, LABD

Note:

The chart below, is a 3-Day chart with Friday, completing the last ‘third’ day.

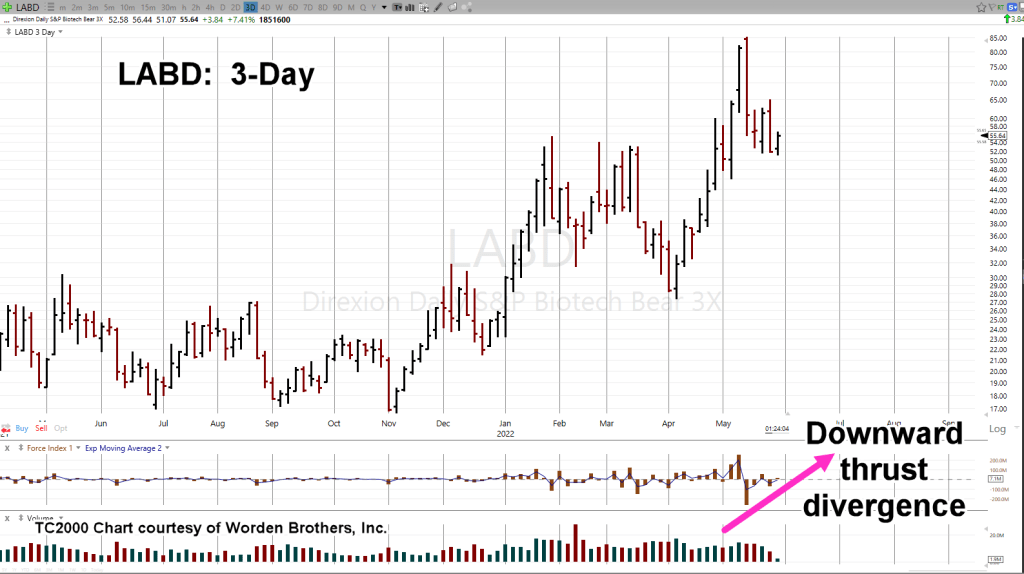
As price action has moved lower, energy behind that move is weakening; seen in the thrust divergence

Why a 3-Day Chart?

When’s the last time you saw a 3-Day, 2-Day, or 6-Day, or any other non-conventional chart in anyone’s analysis?

Anybody? … Bueller? Bueller?

It’s not different, just to be different.

Shown below, we have the same 3-Day LABD, compressed and marked up with a trading channel.

At this juncture, the 3-Day shows the nuances more clearly.

If this trading channel is in-effect, that is, if it’s active, potential exit points for an LABD position at this point in time, would be 105, or 240 (not advice, not a recommendation).

For LABD, to get anywhere close to those points, especially the second (240-level), biotech would need to collapse.

Summary

There’s plenty of chaos to go around. We have those who are still arguing whether or not ‘it’s the bottom’.

Such arguments are potentially (and likely) from those completely unprepared.

As Jerimiah Babe said in one of his latest videos, ‘something’s going to break’.

When or if that break happens, it won’t be to the upside.

Stay Tuned

Charts by StockCharts

Note:  Posts on this site are for education purposes only.  They provide one firm’s insight on the markets.  Not investment advice.  See additional disclaimer here.

The Danger Point®, trade mark: No. 6,505,279

S&P Rally to Continue ?

Dan … We’ve Bottomed Out !!!

‘Hey Dan, the worst is behind us.’

That’s going to age just as well as our picture at left.

Toilet paper across my face, makes me feel so much more safe.

Within the first ten seconds in the link above, Dan from i-Allegedly gets into it.

He still, at this late stage, has people contacting him to say we’re past the bottom.

He summarizes those comments by saying, ‘We’re far from the bottom of anything.’

Then, as if on cue, ‘Economic Ninja‘ comes online to let us know, another 200,000 egg-laying chickens have just been destroyed in a ‘mysterious fire’ … imagine that.

Almost becoming background noise to all this, the S&P 500, in a sharp rally on Friday that looks like it won’t stop.

S&P 500, Summary

Friday’s action took the S&P back to test resistance on waning volume while at the same time, posting a Wyckoff spring to up-thrust.

That’s it in a nutshell.

Daily SPY, Close

With markup notes

Getting closer-in on the candle chart.

Futures Market

As of this post (3:31 p.m., EST) the futures are higher by a tad at +0.52%. The question is, will that carry-through into the Tuesday open?

Of course, that’s not known. What we do know however, is that price is at established resistance and in up-thrust (potential reversal) condition.

Even if the ultimate direction for the market is higher, normal behavior would suggest a pull-back to gather more fuel for such an attempt.

Otherwise, we’re at the danger point; conditions have been set for downside reversal.

Stay Tuned

Update 6:47 p.m. EST:

S&P futures dropping … now up only +0.17%

Charts by StockCharts

Note:  Posts on this site are for education purposes only.  They provide one firm’s insight on the markets.  Not investment advice.  See additional disclaimer here.

The Danger Point®, trade mark: No. 6,505,279

Economic Free-Fall

Anecdotal Data, Says Implosion

As we speak, economic activity is shutting down … fast.

Amazon shipments cancelled, gas stations going dry, banks halt lending, real estate sales collapse.

Meanwhile, the market’s in a short-squeeze.

What happens next?

We’ll discuss real estate and biotech farther down but first the data sources.

Dan from i-Allegedly reports here, he still has a couple of rubes (my word) that think the market just bottomed out.

Good luck with that.

As we’ll show below, the real estate bear market (IYR) rebound, was identified ahead of time.

Next, we have Red Hurricane describing one semi-trailer load after another being cancelled. He hauls for Amazon.

Shipping activity’s contracting, seemingly, by the minute.

Lastly, this link where the D-word, ‘Depression’ is used within the first one-minute, twenty seconds.

Bottom-out in the stock market? Probably not.

So, let’s take a look at real estate IYR, and see where it might go next.

Real Estate IYR, Weekly Chart

The last update (link, here) showed potential to rise into a test of resistance. That’s exactly what happened.

Back then:

And now:

With zoom

Obviously, the upward test happened much quicker than anticipated … but it was anticipated … no surprise.

Real estate got itself into Wyckoff spring position; so, a rebound (test) is normal market behavior … short-squeeze or not.

If it was a squeeze and if it’s over, we can expect an immediate drop in price action. We’ll analyze that as it plays-out in the coming week.

Now, on to biotech, SPBIO

Biotech SPBIO ($SPSIBI), Weekly

Some housekeeping first.

Obviously last week, with being short, more downside action was anticipated resulting in upside for LABD.

On Friday, that did not happen. Biotech was part of the squeeze as well.

The short position via LABD, identified as LABD-22-02, was reduced but not exited completely (not advice, not a recommendation).

At present this is where we are.

First, we’ll start by inverting the chart to mimic the action of 3X inverse, LABD.

Next, we’ll zoom-in and highlight the ‘squeeze’.

Doesn’t look like much when viewed that way does, it?

Next, we’re going to zoom-in, on the zoom

In spite of all the squeeze chaos on Friday, price action could not post a new weekly low (high on the non-inverted).

We’ll see this Tuesday, if that’s important or not.

This post is getting long but let’s end with the rule of alternation. The same chart is marked up below.

If this rule is still in-effect, we’re at a juncture where one can expect a ‘simple’ alternation.

We’ve already had complex action on the prior congestion; so, we can expect current action to be simple in character.

That means, price action’s not likely to stick around at these levels whether it’s going up or down.

Based on the above analysis, the expectation for Tuesday’s open is a gap lower for SPBIO and higher for LABD.

If that does not happen, something else is at work … we’ll report on that as necessary.

Summary

Has the market bottomed out? Not likely.

Those who are at this late stage, still arguing with Jerimiah Babe and Dan (and Patera), that the market’s rebounding, everything’s fine, are in a state of delusion.

The mindless herd following spending with ever newer cars, moving up to the McMansion, opulent vacations, posting it all on Facebook is most decidedly, gone.

It’s finished. It’s Done.

The problem is, as J.B. notes above (time stamp 7:15 and 8:30), those still living that life don’t seem to know it’s over.

For the leaders, the tiny minority and those reading this post, who are, or who have been preparing for years, it means potential huge (life changing) opportunities.

That is, as long as the markets, the banks and other infrastructure stay open; not guaranteed in any way.

Stay Tuned

Charts by StockCharts

Note:  Posts on this site are for education purposes only.  They provide one firm’s insight on the markets.  Not investment advice.  See additional disclaimer here.

The Danger Point®, trade mark: No. 6,505,279

‘Investors’ Buy Dip Over & Over

“Fuel” For The Downside

Once this next level gives way, carnage will (likely) reach all-time records.

Over a centry ago, Wyckoff said in his writings, it’s those on the wrong side of the bull trade, who provide the fuel on the way down.

As reported by Reuters, that downside fuel appears to be building on a massive scale.

The Fed This … The Fed That

What a colossal waste of time … that is, trying to figure out what The Fed is, or is not, going to do.

As The Maverick reports in this update, The Fed has a higher authority. It should be no surprise to any of us at this point … they’re ‘just following orders’.

Mirroring that sentiment is Dan from i-Allegedly, saying ‘This is not the bottom‘.

Part of the reason there’s so much focus on earnings, financials and The Fed, is that it’s a whole lot easier to do that, than actually getting down to work and learning price action.

That my friends, as Wyckoff said in his text Studies In Tape Reading, ‘takes many years and many losses’.

So, let’s take a look at what that ‘tape’ is telling us concerning the biotech market.

Biotech Inverse BIS and LABD

The prior analysis on IBB, is still valid.

However as was done with real estate, changing from 2X inverse to 3X inverse, the same has happened with biotech; from BIS, to LABD.

Since the overall bearish assessment has not changed, this morning’s upward move in the markets was used to re-position to a higher (inverse) leverage vehicle … LABD (not advice, not a recommendation).

The hourly charts below show the exit of BIS and the entry of LABD.

Biotech 2X Inverse, BIS

Biotech 3X Inverse, LABD

As this post is being written 12:55 p.m., EST, price action’s at the danger point.

We’re at the extreme; the risk is least but price can go either way.

Summary

Watching that action in real time, it looks like LABD wants to go higher; currently trading at 57.20-ish.

If LABD is higher, that means SPBIO, is moving lower.

Unless price action of biotech (IBB, SPBIO) and the overall markets signal a change of behavior … the bear move is still in play.

If we get a significant break lower, ‘retail’ that’s not positioned properly, will provide the majority of downward thrust energy.

It’s no different than it was in Wyckoff’s time, over a century ago.

Stay Tuned

Charts by StockCharts

Note:  Posts on this site are for education purposes only.  They provide one firm’s insight on the markets.  Not investment advice.  See additional disclaimer here.

The Danger Point®, trade mark: No. 6,505,279

Biotech … The Breakdown

Wedge Break Has Been Tested

It’s been a while since we’ve talked about the chief cook and bottle washer in this whole financial collapse scenario.

However, biotech has not been forgotten.

There are two indices (ETFs) being tracked: IBB and SPBIO.

Both entered bear market territory long ago. SPBIO topped out, way back in February 2021; IBB topped later, in August the same year.

Leveraged inverse funds are LABD, and BIS, respectively. LABD is 3X inverse with BIS a 2X inverse.

The Long Term

One thing unique to David Wies, was to look at the long term: Monthly, Quarterly and Yearly charts.

Doing so, puts one in a strategic mindset … not easily swayed by the latest prattle from media sources.

If we look at biotech, IBB, on a quarterly basis we have the following chart.

Biotech IBB, Quarterly

The mark-up of this chart is where it gets interesting.

A terminating wedge that’s been over seven years in the making has just broken to the downside.

Not only that, when we get closer-in (on the weekly), we can see the wedge break has been tested and now today, appears to be reversing to the downside (shown on daily).

Biotech IBB, Weekly

With zoom

The daily shows a Fibonacci retrace to 38%; then today, a downside reversal.

You can see where this is going.

Based on the above analysis a short position in IBB, has been opened via BIS (not advice, not a recommendation).

The trade is BIS-22-01, with an (initial) entry @ 28.5173

Summary

The news on specific biotech companies is already out if one knows where to look.

Stated time and again on this site, we’re just in the beginning stages of the repercussions.

It even looks like they’ve moved on from the initial scam and are cooking up a new one.

Stay Tuned

Charts by StockCharts

Note:  Posts on this site are for education purposes only.  They provide one firm’s insight on the markets.  Not investment advice.  See additional disclaimer here.

The Danger Point®, trade mark: No. 6,505,279

Could Real Estate Rally?

How Is That Possible?

It’s possible, because price action is always the final arbiter.

Before the rest of the report, some housekeeping.

Real Estate IYR, has broken the down trend lines previously discussed.

A discretionary (not stop related) exit was performed on all positions at approximately DRV 46.45.

Trade DRV-22-02, is officially closed.

If the market turns around and looks like IYR is about to resume its downtrend, the DRV position could be re-established (not advice, not a recommendation).

As it stands, profit on the entire DRV-22-02, was in the vicinity of +19.2%.

That’s not too bad, considering the rest of the population is losing their shirts as reported here.

There were 25 DRV, transactions during the trade.

Where to Now?

Real estate can resume the downtrend, or it can test the underside of support, now resistance (shown below).

Under ‘normal’ market conditions, a test is typical behavior.

However, we’re in a financial collapse so anything is possible.

Real Estate IYR, Weekly

The chart above paints a familiar picture.

The overall trend is down. However, that does not mean price can’t go higher.

In fact, as we all know, the sharpest rallies occur in the middle of bear markets.

Whether we get one now, is unknown. Typical market behavior is to come back to the resistance area (black axis line) for a test.

Summary

From personal standpoint, I’ll take the near 20% gain (not advice, not a recommendation) and stand on the sidelines for a more definitive set-up.

Stay Tuned

Charts by StockCharts

Note:  Posts on this site are for education purposes only.  They provide one firm’s insight on the markets.  Not investment advice.  See additional disclaimer here.

The Danger Point®, trade mark: No. 6,505,279

Weekly, Wrap-Up

The Usual Suspects

No. 1

Carvana Fires 2,500 Employees

We didn’t see that one coming. Or, did we?

Just a quick review of this report posted over six-months ago:

“If your biggest claim to fame is that you ‘invented’ a vending machine … you’ve got real problems.”

“As the economy (if you can call it that) falls off the cliff, one of these two (CMX, CVNA), is not likely to survive.”

Well, looks like we have the answer on that one.

From the date of the report above to last Friday’s close, CVNA, is down -87.8%.

Measured from all-time highs, CVNA, is down -91.1%.

As CVNA, swirls down the drain of ‘disruption’, looks like it was only a blip in the land of ‘status quo’.

No. 2

The ProLogis ‘Connection’

Is this a re-print of a prior report?

No, the update below, is essentially a confirmation of the analysis in that (above) report.

Turns out that Amazon (link here) is in negotiations with chief cook and warehouse bottle-washer, ProLogis (here) about terminating massive amounts of lease space.

The entire affair, is an irrefutable confirmation of the Wyckoff analysis method.

That is, ‘the market itself defines it’s next likely course’.

Those on the inside always know something; that ‘something’ (i.e., their actions) shows up on the tape.

After the initial ‘ProLogis Connection’, a follow-up was posted that identified the largest down-thrust energy in ProLogis history.

From that report was this quote:

“We’re using PLD, as the proxy for the real estate (IYR) sector as it’s the largest cap equity.”

“That’s true for now … but maybe not for long.”

How quickly things change.

ProLogis is now the number two in the IYR market cap and very close to being third.

No. 3

Wealth Confiscation Coming Soon

The first two bullets perceived events before they happened, so let’s make it three-in-a-row.

This one’s pretty much a no-brainer.

During the last meltdown in 2007 – 2009, IRA retirement accounts came within a hairs-width of being confiscated.

This time around, could be for sure.

The following’s a section of a report written years ago.

It’s even more relevant now.

Begin Report

4/7/19

Government To Confiscate IRAs?  It’s Easy

There has been enough time for the American working (and saving) public to take the lessons of the 2007- 2009 meltdown and act accordingly.

One of those lessons would have been to realize, just how close they came to having their IRAs confiscated.

Personally, I’m surprised that any of the following links below are still active.  Well, who’s looking at this stuff anyway?  Certainly, not the general public:

Dems Target

Fact Check

Congress considering

Government to Confiscate (no longer active)

Confiscation of Private Retirement

Even in the Wall St. Journal:  Targeting your 401K

After reading several of these reports in 2009 and later, it did not take long for me to set the plan in motion to cash out … completely.  I took the 10% penalty, while it’s still 10% and liquidated my accounts.

The rest of the population?  Not so much.

I think it was Prechter who laid out just how easy it is for the government to seize IRA accounts.  It’s basically a two step process.

Step 1.  The market drops 50% to 70%.  Remember, the drop from 2007 to the bottom in 2009 was 58%.

Step 2.  Declare a state of emergency (executive order) for the working population and move in to “save” the IRA accounts from more devastation.  The result would involve a stiff withdrawal penalty (say 50%) and to “protect” the accounts from further losses, IRAs can only invest in U.S. Treasuries or Bonds.

It’s that easy. 

As stated previously, wealth does not necessarily mean gold and silver.  That too can (and has been in the past) be confiscated.

In fact, I and my firm are already operating as if the next crisis is in full swing and asset confiscation is the norm.  That way, we don’t have to come up to speed quickly in what may be an extreme stress situation. 

End Report

One could propose that (IRA) legislation is already written.

Just like the CARES Act was already written and submitted to committee in January of 2019, nine months before there was any kind of outbreak.

Stay Tuned

Charts by StockCharts

Note:  Posts on this site are for education purposes only.  They provide one firm’s insight on the markets.  Not investment advice.  See additional disclaimer here.

The Danger Point®, trade mark: No. 6,505,279

Gold … After The Reversal

Changing of Hands’

It’s a significant, if not major event, when one market participant (collectively) hands off the trading vehicle to another.

In a decline, that usually means the ‘average investor’, the least disciplined, least knowledgeable, gives up and hands off to the professionals; the ‘strong hands’.

In a blow-off top, the reverse is true.

The professionals lead the ignorant along with whatever narrative is necessary so that enough volume is created to successfully exit positions.

The changing of hands for gold and gold miners, was identified on this site, here, here, here, here, here, here, and here, starting over two-and-a-half months ago.

The analysis was consistent throughout; we are not in a long-term, sustainable, bull market. That stance applied most specifically to gold miners GDX, and GDXJ.

For that assessment to change, price action itself would have to change character; not the lagging momentum indicators, moving averages, price oscillators and so on that are themselves, defined by price action.

So, let’s take a look at what gold (GLD) is saying about itself.

Gold (GLD), Weekly Chart

First, the un-marked chart.

Next, we see a medium to long term trendline that’s been decisively broken and tested.

Getting closer-in, we can see the oscillation about the line, the break and subsequent test (with reversal).

What’s Next?

Well, that brings us to Harry Dent.

Love him or hate him. Here he is, offering up a perspective that’s not going to be popular.

How can gold (GLD) decline from here?

Let’s take a look.

If the wedge above is in-effect, if it’s the dominant factor at this point, then a break depending on location would take GLD down to about 130-ish.

If that happens, it will be a big event … down to approximately $1,300/oz.

However, it’s what may come next, that will be totally unexpected.

It’s interesting, the wedge in blue has a measured move target right to the bottom of the larger wedge in magenta.

To get below $900/oz, will be a very different place.

With that in mind, this site has presented time and again, we’re in an unprecedented world-event.

‘Normal’ is not coming back … ever.

Awake, or Not

Jerimiah Babe, in one of his latest videos hints there’s a strange vibe to what’s happening: Time stamp 5:20,

‘There’s something going on here …’

The Fed may actually be telling us the truth … just not in the way we expect.

You have to be awake to read between the lines.

Inflation may indeed be ‘transitory’ as they say because consumer demand is going to evaporate.

Evaporate not because the consumer can’t afford it, but because there are, or will be, no consumers.

Stay Tuned

Charts by StockCharts

Note:  Posts on this site are for education purposes only.  They provide one firm’s insight on the markets.  Not investment advice.  See additional disclaimer here.

The Danger Point®, trade mark: No. 6,505,279


Real Estate … ‘Train Wreck, Ahead’

Channel Confirmation

Does it really matter if IYR’s channel is at -99%, or -93.5%?

The sector’s going down fast; that’s the important part.

Unless there’s some kind of decisive, high-volume break to the upside, we’ve got IYR in a confirmed trading channel, declining at approximately – 93.5%, on an annualized basis.

The morning gap open in IYR, was higher as expected; sated in the pre-market report.

However, instead of reaching the 100%, ‘a-b-c’ target, where wave ‘a’ would be equal to wave ‘c’ (a common occurrence), the gap higher only reached a 61.8% target: indicating significant weakness.

The daily chart, has the situation as of 11:30 a.m., EST

Real Estate IYR, Daily

One thing that’s not happened yet … there is no new daily low for IYR.

It has not posted below yesterday’s low of 93.70.

That’s about the only factor that remains as potential upside for the sector.

If yesterday’s low is penetrated, then it weights probability significantly to the downside (not advice, not a recommendation).

Stay Tuned

Charts by StockCharts

Note:  Posts on this site are for education purposes only.  They provide one firm’s insight on the markets.  Not investment advice.  See additional disclaimer here.

The Danger Point®, trade mark: No. 6,505,279

Saved By the Bell

Closer Look At Real Estate

No sooner than yesterday’s report was released, IYR price action broke upward through its down trendline.

However, the action remained weak with successive attempts to move higher being thwarted.

The sector closed down for the day.

That’s the way of the markets … set ups materialize, come to fruition or fade away.

It’s 20-minutes, before the open; IYR shows higher action.

Based on the bid/ask spreads, we can see on the hourly chart below, action may be about to complete an ‘a-b-c’ corrective move.

Real Estate, IYR Hourly Chart

The area of interest is identified by the magenta circle.

The second chart shows that action with the Fibonacci projection.

Closer-in with Fibonacci ‘a-b-c’ projection

Recall, the rule of alternation says, ‘last time is not this time’.

Price action from yesterday’s session was choppy and overlapping. Today looks to open sharp gap-higher and thus, fulfills the ‘alternation’.

Summary

Obviously, it’s what happens after the open, that’s important.

A swift retrace/reversal and posting an hourly down bar would point probabilities to continued downside for the day.

If we get upward buoyancy instead, we may be in for a protracted upward test.

The hard-stop for the current DRV-22-02, position is unchanged at DRV 45.64 (not advice, not a recommendation).

Stay Tuned

Charts by StockCharts

Note:  Posts on this site are for education purposes only.  They provide one firm’s insight on the markets.  Not investment advice.  See additional disclaimer here.

The Danger Point®, trade mark: No. 6,505,279