The Nat-Gas report is out tomorrow. Price action is set to move higher.
It’s not perfect. A better set-up would have more volume at the support penetration.
So, we’ll see how it goes early in Thursday’s session.
Charts by StockCharts
The Nat-Gas report is out tomorrow. Price action is set to move higher.
It’s not perfect. A better set-up would have more volume at the support penetration.
So, we’ll see how it goes early in Thursday’s session.
Charts by StockCharts
Ever since the “Derecho”, the inland hurricane, it has not been the same for corn.
ETN, CORN, shows we’re at a 38% retrace that’s also support.
Next crop progress report is scheduled for October 5th.
The volume characteristics for CORN have changed over the past four months.
There is trading interest in this sector.
Last year, trading volume in CORN had died-off by this time. Not so, this year.

Charts by StockCharts
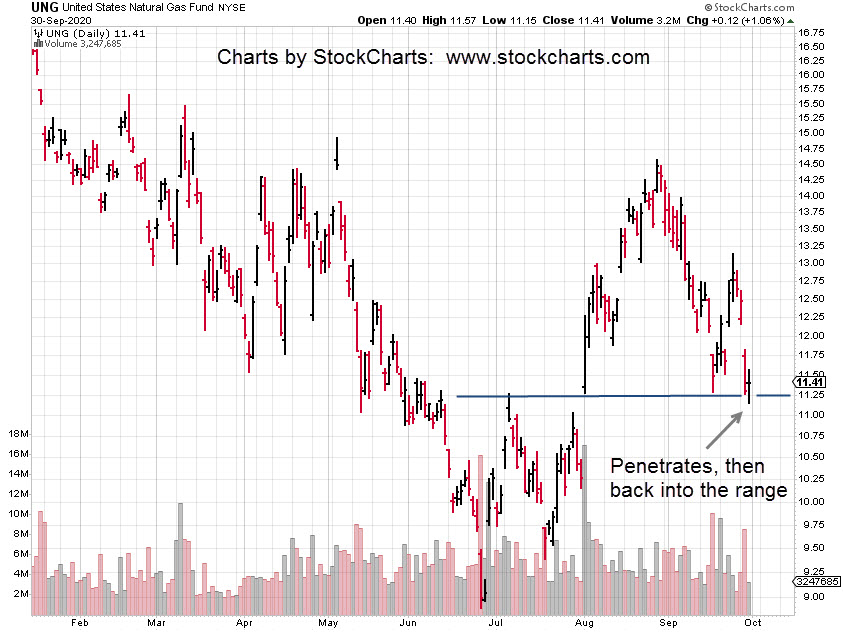
Natural gas price action (UNG) could be a case of sell the rumor, buy the news.
The EIA Natural Gas Report comes out at 10:30 a.m. EST, this Thursday.
The 61.8%, retrace level (from the June low to the August top) for UNG is around the 11.04, area.
If UNG continues lower in the next session and does not make significant headway (down), it may have found a bottom ahead of the report.
Note that price action can get volatile for a few minutes after the release.
Nat-gas is similar to silver in that regard … stop run attempts (and spikes) are the norm.
We’ve already come off a long term low during June this year. Now, we have seen a recent Sign Of Demand (using a Wyckoff term) during the past week … it all suggests bias to the upside.
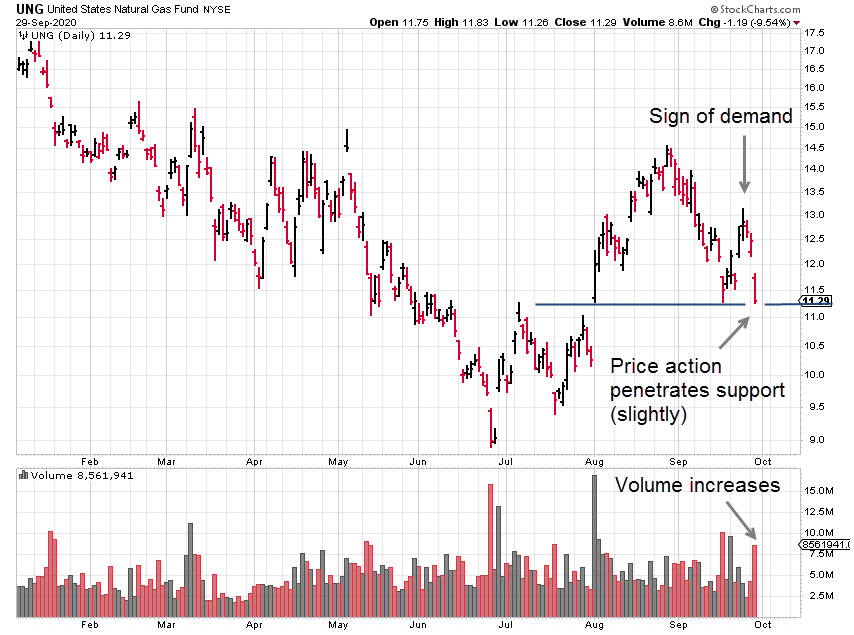
Expandable version of the chart is here.
Charts by StockCharts
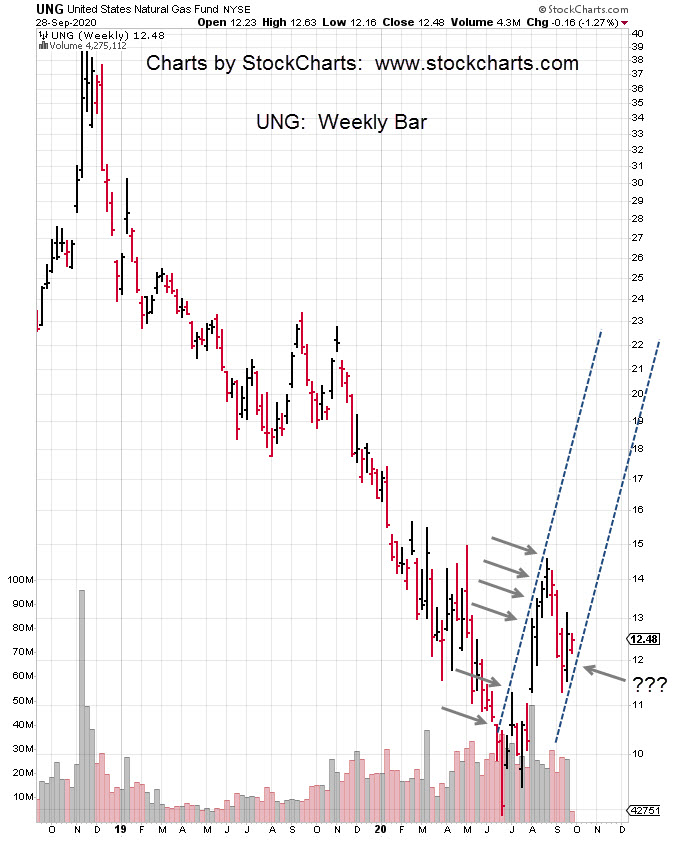
Trading lower in the pre-market session is UNG.
The weekly chart shows obvious hits on a left side trend line.
Moving that line to the right edge, there may be a hit/confirmation during the upcoming session.
An obvious stop level (not advice, not a recommendation) would be last week’s low at UNG: 11.51
Charts by StockCharts
Those late to the game on BTU may have cashed out with losses on Friday, September 25th.
So-called ‘expert’ (buy) opinion came out on the 17th and since then BTU has declined anywhere from -8%, to -27%.
We exited our BTU long on the 18th, with a 15.5%, gain.
Now, we see BTU contacting a nascent trend-line. There could be a trading channel formed as well.

If BTU maintains the trend, it’s rising approximately +3,000%, annualized.
At that rate, a 100% gain on a long position (not advice, not a recommendation) would take about six-weeks.
In other markets, biotech (IBB) pre-market action shows a higher open. If that’s the case, we’ll exit (not advice, not a recommendation) the BIS position and stand aside.
Update: 9:54 a.m. EST: IBB is reversing immediately from its open. BIS position maintained (not advice, not a recommendation) at this point.
Update: 2:39 p.m. EST: BIS exit @ 31.591
Charts by StockCharts
Short out, short in. That was the trade action for Friday, the 25th.
The pre-market update hinted price action would rise; taking out stop orders at the area shown. IBB did just that and more.
Early in the session, within about thirty minutes it was obvious that we’re moving higher. The BIS position was exited at 33.10.
Profit on the short, held for ten days was about 6.5%.
Price action continued to rise throughout the day. Late in the session, the short was re-established via another position in BIS.
Not expected, was that IBB continued to move higher into the close of the day.
BIS moved correspondingly lower.
The position is showing a slight loss of -1.5%. This amount is well within risk parameters but does require that IBB opens lower and moves lower at the next session.
The chart, with an expandable version here, shows we’re at the top edge of an established trading channel.
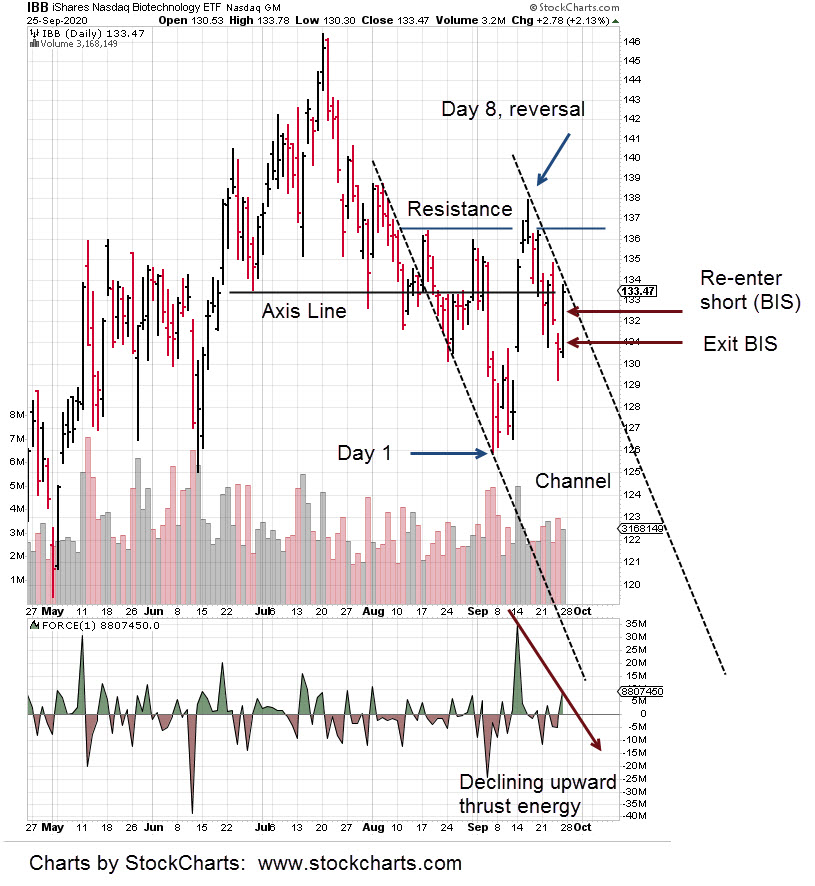
Force Index, upward thrust energy has declined while at the same time price action finished the day right at the axis line shown.
There’s also a Fibonacci time sequence as noted.
The expectation is for a lower open and lower action during Monday’s session.
If price action opens higher, the short-covering scenario as identified in this update, is not in effect; the short position will be closed.
Charts by StockCharts
The market itself has decided the lower wedge-line is important.
Price action penetrated, then recovered, penetrated again and is now testing the underside.
This oscillation about the line validates its existence and confirms its importance.

AMGN is at the danger point. Price action can go either way.
Higher, and the wedge has been negated. Lower and we may have a strategic, long-term reversal.
Separately, the short position via BIS at the trader’s discretion was exited early during Friday’s session.
When it’s obvious, we did not wait around for the stop.
The total profit on the short, held for just ten days, was about four-weeks pay for the typical American worker.
Why list it in those terms?
With at least 30% of the population out of work and no job in sight, would it not make sense to show how proper research, experience and training may replace some of the lost income?
Getting back to the biotech short position; Later in the session, as IBB was rising, BIS declining, the short was re-established.
More on that entry is planned for tomorrow’s discussion.
Charts by StockCharts
That was the day where the bear market began in earnest. After that day, it never looked back.
The final posted low was 666, on March 6th.
Let that sink in for a while: Six-six-six, on the sixth. There is much more going on than the general public realizes.
We wrestle not with flesh and blood …
Getting back to that day on June 5th, those old enough will remember the market had been trending lower for about three weeks.
Then, on Thursday the fifth, there was a huge rally. The S&P moved up over 2% on the day.
This rally as it turned out was just short covering. The next day, price opened gap-lower and moved swiftly lower to new daily lows.
The move down was about -3.5% on the day. There was no denying at that point, it’s a bear market, potentially a crash (which it was).
Is that same scenario what just happened today, Friday?
Looking at the analysis that Sajad put out on August 15th He showed “there’s one final move to go”: Time stamp, 5:20

His quote is shown on the chart. Indeed, the Dow 30, the DIA, had one more move to go before reversal.
If the coming Monday, opens gap lower and posts a new daily low, the market is performing in a way that’s similar to June 5th of 2008.
Charts by StockCharts
It’s about 20-minutes before the open.
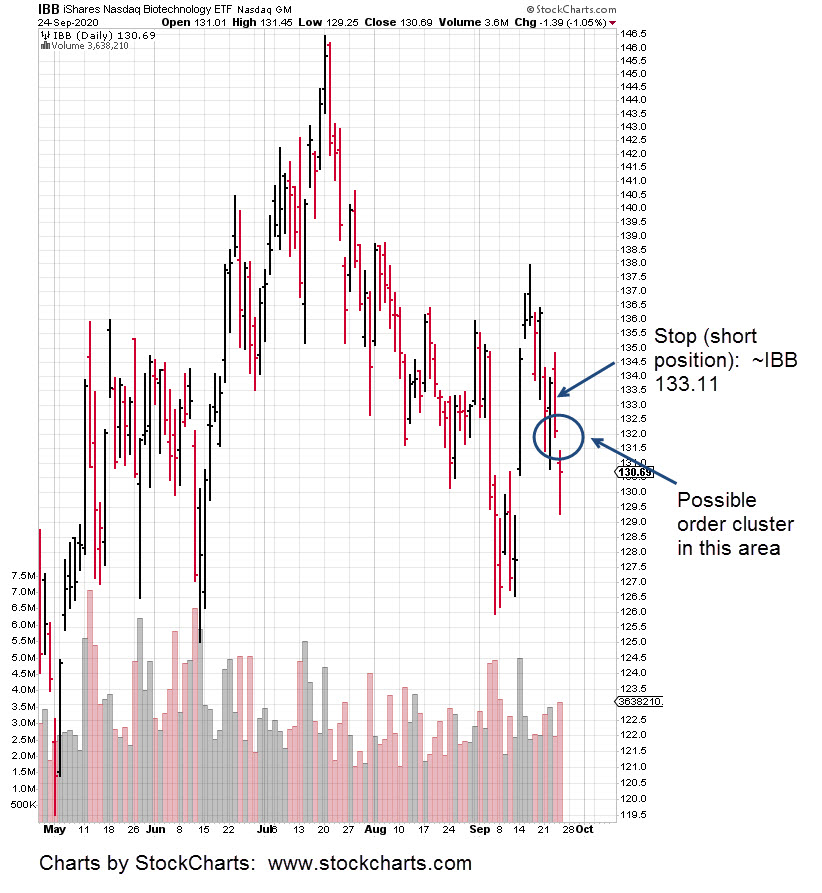
For those monitoring the short trade in biotech (IBB), the stop has been moved (not advice, not a recommendation) to the area around IBB, 133.11.
This is the middle of the trading range from September 23rd.
There may be orders hiding right around IBB 132.00 – 132.40 and the market could attempt to search these out.
We’ll see.
Annotated chart below:
Charts by StockCharts
Amgen (AMGN) was covered in the last update as having a wedge breakout to the downside.
Price action then promptly reversed back into the wedge, giving the equity a new lease on life.
At least, that’s the way it looked at the time.
If we pull out to one time frame higher … the weekly, and look at AMGN, the reversal set-up and possible channel(s) are clear.

The terminating, rising wedge is there. However, we can see several trend-line symmetries.
Taking the solid blue trend-line (right side) and bringing it backward (dashed lines), sometimes referred to as “reverse trend-line”, there’s symmetry in the AMGN set-up.
We may be witnessing the strategic reversal of AMGN which has already developed a massive trading channel.
Charts by StockCharts
