Market ‘Blow-Up’ … Already Here

Hidden Behind The Curtain

It’s got that 2008, feel all over again.

This time, instead of, The subprime crisis is contained”, we have, ‘The banking crisis is over’.

Back then, as the market crashed into ’09, and then forced (manipulated) higher into 2010 and later, you intuitively knew the next time, there’s no saving it (not advice, not a recommendation).

So, here we are … at the ‘next time’.

However, this time around, it’s different … very different.

Coming out nearly every day, is the massive driver to the downside: Biotech. The updated list on that sector is provided at the end of this post.

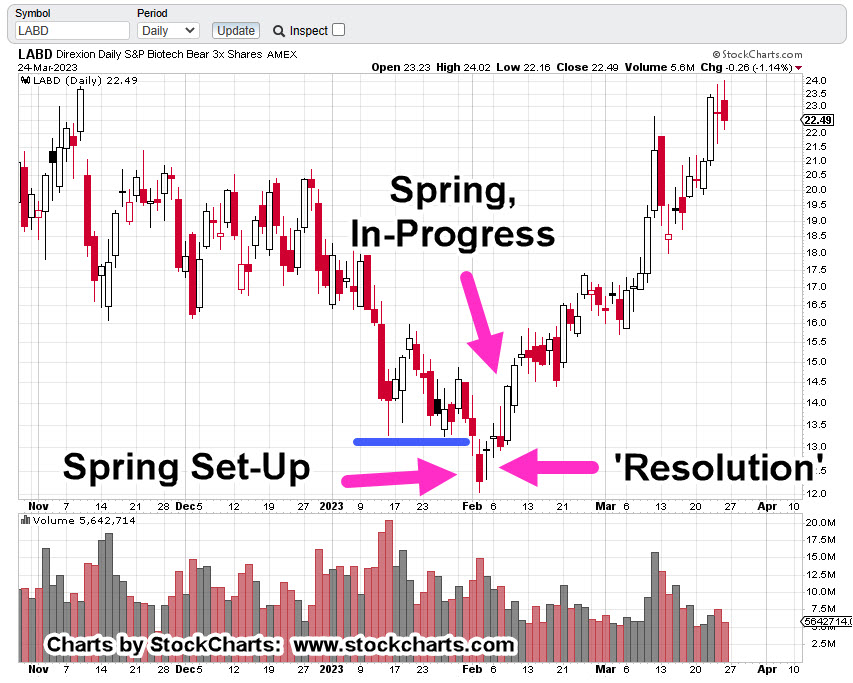
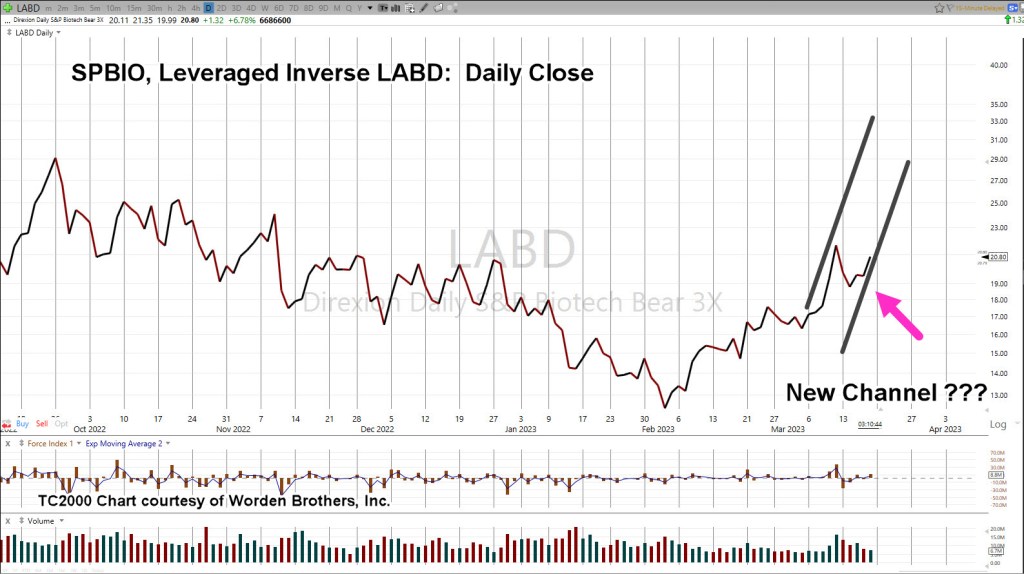
For this update, we’re looking at the technical condition and more specifically, biotech leveraged inverse fund LABD.

Biotech Leveraged Inverse LABD, Daily

We’re early in the session (11:03, a.m., EST) and we can see a reversal (if it holds) developing.

Today, is also Fibonacci Day 5, from the high set last Friday, the 24th.

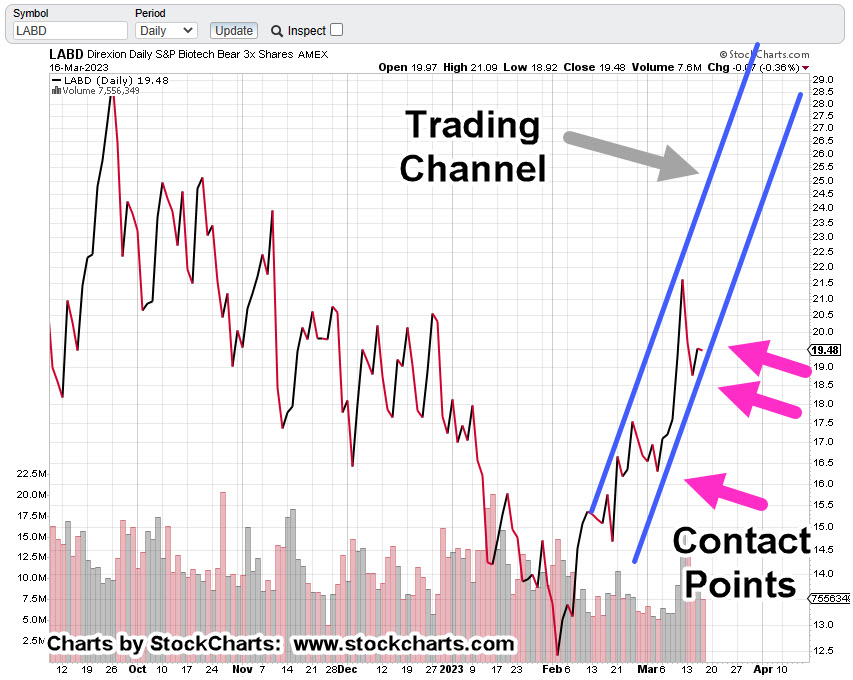
Since today may be a pivot to the upside (biotech index lower), a potential continuation channel line is drawn in the chart below.

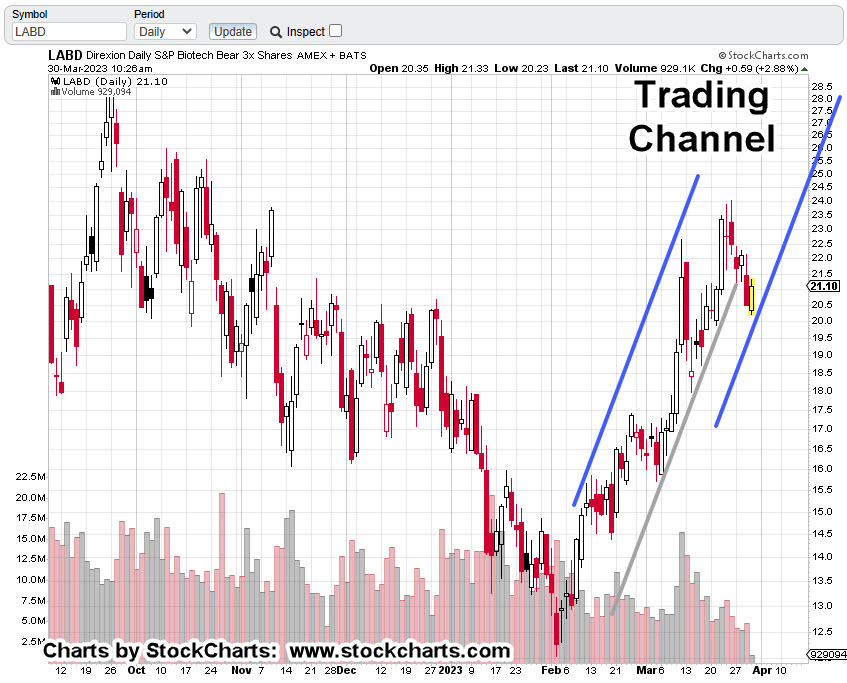
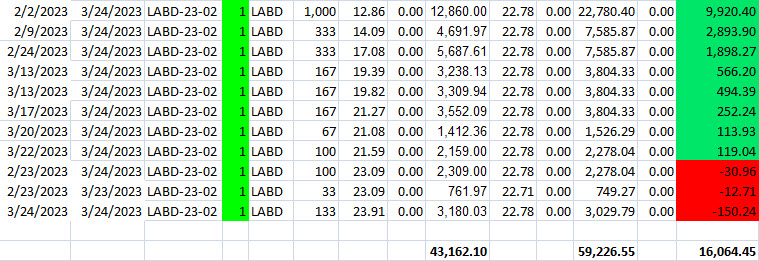
As mentioned in the last update, a retrace was probable and hence taking profits with a partial exit.

During the past four trading days, that position has been re-established at lower prices (not advice, not a recommendation).

Insurmountable Fundamentals.

At some point unknown to us, the fundamentals will come into play.

The conditions are insurmountable … they can’t be ignored.

Said many times, this is the driving factor for the market(s) on a go-forward basis (not advice, not a recommendation).

Latest on The Biotech List

We’re going to start first with an article that surmises, the blow-up has already happened. That article is here. The report starts off with profanity; be advised.

Then, the biotech list; growing without bound:

Risk Of Cardiac Death Tripled For Young Women Following AstraZeneca COVID-19 Vaccination: Study

Bombshell Vax Analysis Finds $147 Billion In Economic Damage, Tens Of Millions Injured Or Disabled

CDC Found COVID-19 Vaccine Safety Signals Months Earlier Than Previously Known, Files Show

Three Years To Slow The Spread: COVID Hysteria & The Creation Of A Never-Ending Crisis

Biden Signs Bill To Declassify COVID Origins Intel

“I Couldn’t Remain Silent”: Physician Assistant Fired For Reporting COVID-19 Vaccine Adverse Events To VAERS

A Haunting Anniversary – ’15 Days To Slow The Spread’

Bonfire Of The COVID Vanities

Judge Rejects Request From Moderna, Moving Key COVID-19 Vaccine Case To Discovery

Betting All On Hegemony; Risking All, To Stave Off Ruin

CDC, FDA Respond To Florida Surgeon General’s COVID-19 Vaccine Safety Alert

WHO Chief Says Quest For COVID Origins Remains “Morally Imperative”

Italy 2020: Inside COVID’s Ground-Zero

The Forced Medication of All Citizens

COVID Conspiracy Theories Become Conspiracy Facts

Biden Admin Evaluating Mass Poultry Vaccination Amid Persistent Bird Flu Outbreak

Mother Sues Doctor Who Allegedly Administered COVID-19 Vaccines To Children Without Consent

COVID “Not Deadly Enough” To Justify Risk Of Fast-Track Vaccines, Chris Whitty Told UK Govt

Scott Atlas: America’s COVID Response Was Based On Lies

Stay Tuned

Charts by StockCharts

Note:  Posts on this site are for education purposes only.  They provide one firm’s insight on the markets.  Not investment advice.  See additional disclaimer here.

The Danger Point®, trade mark: No. 6,505,279

Biotech (Short) Trade Nets + 37%

Just Part of The Story

I once had an Uncle tell me:

“Percentages are for liars”

There may be doubters, haters, even money managers reading this and thinking that as well.

So, we’re going to get into it.

We’ll address the ‘liar’ claim, present the current state of biotech along with partial exit of the short position (not advice, not a recommendation).

Fundamentals: The Rats Scramble

Anyone with two-boosters rubbing together can see the rats scrambling; attempting to ‘normalize’ the abnormal.

For example, it’s now ‘standard procedure‘, after a Pilot’s ‘incapacitated’ (i.e., potentially drops dead) in the cockpit to roam about the cabin and ask if there’s anyone else available to fly the plane.

You can’t make this up. Nothing to see here.

Now, on to the charts.

First: Let’s Review

The chart re-printed below, is how it looked this past February 9th, as presented in this post. Recall, the actual reversal was identified to-the-day, in this post.

To go even a bit further, the Wyckoff penetration set-up was identified a day earlier, in this post.

SPBIO Leveraged Inverse LABD, Daily

Re-printed from February 9th.

Fast forward to now. This is how it looked on Friday.

From the chart above, the reversal is well underway.

Momentum has slowed a bit, hence the reason for the position to be reduced by about 13%.

If the decision to partial-exit was wrong and LABD heads immediately higher, there’s still a sizable position open.

If LABD spends the next several days contracting lower (as anticipated), there may be an opportunity to re-acquire the exited position at a lower level (not advice, not a recommendation).

The next chart shows the current trading channel.

It won’t take much sideways to down action to contact the right side. If or when that happens, we’ll see how price action behaves.

Where’s The Lie?

The spreadsheet below, is a modified version of what’s used by my firm. Note, it’s not the actual shares traded but a representation of that action.

The chart has been simplified with the initial entry (of this series) adjusted to 1,000 shares. Subsequent entries are adjusted by the same factor as the initial entry.

For the engineers, the data has been ‘normalized‘.

Working the numbers; we have $43,162.10 initial cost, $59,226.55 at the exit, yielding $16,064.45, which is just over a +37%, gain.

If there’s a lie in all of the above data, the analysis identifying the set-up, the reversal and subsequent trading actions with partial exit, I’m not sure where it is. 🙂

Note: The two left-most rows of ‘zeros’ in the chart are for commission charges. The spreadsheet was developed way back in the day when we had such things.

The right-most row of ‘zeros’ is open profit/loss.

Stay Tuned

Charts by StockCharts

Note:  Posts on this site are for education purposes only.  They provide one firm’s insight on the markets.  Not investment advice.  See additional disclaimer here.

The Danger Point®, trade mark: No. 6,505,279

Gold … Analysis for Engineers Only

It’s Not About ‘Right’, or ‘Wrong’

For the typical engineer, this is probably the most difficult concept to grasp and overcome in the markets:

‘It can’t be calculated’.

Of course, being engineers, they’ll argue about ‘Quants’, ‘Artificial Intelligence’, and the now long forgotten, ‘Watson’.

What ever happened to that so-called computerized answer?

Back in the day, another engineer told me for months on end, how ‘Watson’ was going to change everything.

The ‘machine’ was going to affect my trading. Naturally, he could not say how (when asked), just that it was.

As far as I know, Watson has not been in the news for years.

Enough said.

So, the typical engineer might look at the previous gold updates (here and here) and gesticulate, “It’s wrong!”.

That type of thinking is called a ‘Mind-Trap‘. It’s not about ‘right’ or ‘wrong’.

It’s The Ephemeral ‘Probability’

For gold at this juncture, there’re so many moving parts with some known, and likely many more, unknown.

However, from a strategic standpoint, the probability is we’re at The Danger Point®

As we speak, there’s a panic into the metal that’s not being confirmed by the other monetary metals, Palladium, Platinum, and Silver.

Yet, even with the ‘panic’, gold (GLD) remains below the previous ‘Invasion’ spike high, shown below.

Gold GLD, Weekly

Each market ‘extreme’ (so far) is lower than the last.

As can be seen by the blue line, we’re right at resistance and the ‘test’ of the prior spike high.

The chart below paints a more ominous picture (for the downside).

If GLD, can’t push higher from here and begins to retrace, it potentially confirms the wedge pattern.

A ‘terminating wedge’ is typically the last part of a move before reversal.

Why A Reversal?

As mentioned, there’re a lot of moving parts. There’s also an unprecedented amount of debt world-wide that’s now coming under strain to say the least.

The SVB collapse and others, likely set events in motion not yet fully revealed to us in the serfdom.

Sovreign nations have sold gold to pay off debt in the past like this example.

How much more debt do we have now, versus then?

The Big Surprise

So, it’s not about right or wrong or getting the top tick before reversal. It’s about the probability.

That probability says we’re at a confluence of debt, interest rates, price resistance, market patterns and (potential) sentiment extremes.

No one expects a major downside reversal in gold. It would be a massive surprise, if it happens.

Stay Tuned

Charts by StockCharts

Note:  Posts on this site are for education purposes only.  They provide one firm’s insight on the markets.  Not investment advice.  See additional disclaimer here.

The Danger Point®, trade mark: No. 6,505,279

Gold … The ‘Bubble’ Wins

At Least, For Now

The rabid gold bulls … foiled again.

From the last update (emphasis added):

“Gold (GLD) either reverses from here or moves slightly higher to the 187.50-area before reversing.”

Immediate reversal is exactly what happened.

Actually, gold did go higher to the targeted (GLD 187.50) area in the overnight session; then reversed before the regular session open.

So, it did both of the forecasted moves. 🙂

The ‘Real’ Unemployment

By now, anyone with two pension-plans rubbing together, knows the numbers … that is, any ‘official’ numbers are complete propaganda (not advice, not a recommendation).

For example, the ‘real’ unemployment here, is likely closer to 25%, rather than the ‘official’ level below 4%.

Keep that in mind, as we continue on.

Gold GLD, Weekly

The GLD, weekly has the three major tops with the current (potential) one included.

The second chart (the daily) focuses on the reversal; in technical terms a ‘Wyckoff Up-Thrust‘.

Gold GLD, Daily

Right now, we’re at the test or The Danger Point®; it won’t take much force to move price action either way.

Pointing probabilities to the downside, we have a repeating pattern of ‘Spring to Up-Thrust’.

It’s an observed empirical phenomenon, markets tend to go from a Wyckoff ‘spring’, straight into an ‘up-thrust’.

The New ‘Paradigm’

Well, we probably to have a new paradigm but it’s not in gold (not advice, not a recommendation).

That new paradigm is what no one will discuss.

In the opinion of this author and contrary to what is presented here and here (remember our ‘unemployment’ numbers) we’re in a full-scale demand and population collapse.

The ‘inflation’ for possibly a large part, has been manufactured.

You can’t have over one-hundred food processing plants mysteriously burn down (bug, insect factories not affected) with millions upon millions of egg laying hens destroyed, cattle herd at 1962, lows and not affect the price.

For whatever reason, the mainstream has decided to reveal to the masses what’s been known for years to those who are awake.

Of special interest, Tucker Carlson interview, linked here.

Going Forward

Gold’s at The Danger Point®.

If it can’t make it higher from here on so much apparent and ‘rampant’ inflation, there’s a real risk of it being affected by some kind of Sovereign default … somewhere.

A default would potentially lead to a massive asset sell-off; including everything that’s not nailed down … i.e., gold.

Stay Tuned

Charts by StockCharts

Note:  Posts on this site are for education purposes only.  They provide one firm’s insight on the markets.  Not investment advice.  See additional disclaimer here.

The Danger Point®, trade mark: No. 6,505,279

Gold … Bubble or Breakout ?

We’re About To Find Out

As this post is being created the Credit Suisse battle, rages on.

Recent updates are here and here.

Of course, it’s all planned chaos … but that’s a discussion for another time.

The apparent response from gold (GLD) over the past week, was to move sharply higher.

As expected, the gold bulls are in their brain-stem mania.

Once again. It’s a ‘new paradigm‘.

With that, let’s not forget the last time we had a ‘new paradigm’. Gold has not been higher, since.

Trading opportunity? … Maybe.

New ‘Paradigm’? … Probably, not.

Different, This Time?

As we’ll see below, there are potentially two outcomes for the price of gold (not advice, not a recommendation).

First: Gold (GLD) either reverses from here or moves slightly higher to the 187.50-area before reversing.

… OR …

Second: GLD, pushes higher, just shy of the 200.00, mark, while getting itself into a Wyckoff up-thrust condition.

The first chart shows the extremes as of Friday’s close (Sunday futures, yet to open).

Gold GLD, Weekly

Concerted effort to destroy (or pollute) the food supply began with the Derecho. That effort continues to this day.

Secondly, we have the ‘invasion’ of Ukraine. Note the GLD spike is lower than the Derecho.

Now, we have the banking ‘collapse’. Once again (so far), the upward spike is lower than previous.

Looking at the second chart, we see a Fibonacci projection to 50%, the GLD 183.77-level; exactly where GLD, closed on Friday.

Empirical observation over many years has revealed, if price action gets to a 50% projected level, it’s typically on its way to higher levels.

A Lower Peak

Even if GLD moves up to the 61.8% projection as shown, the GLD 187.50-area, it’s still below the prior ‘Invasion’ peak set at GLD 193.30.

If GLD, moves significantly past these levels, then it’s likely on to new, all-time-highs and a potential Wyckoff Up-Thrust (reversal) condition.

If it happens, we’ll address it at that time.

Stay Tuned

Charts by StockCharts

Note:  Posts on this site are for education purposes only.  They provide one firm’s insight on the markets.  Not investment advice.  See additional disclaimer here.

The Danger Point®, trade mark: No. 6,505,279

Alcoa: Another ‘Chief Cook’

Yet, One More ‘ESG’ Opportunity

Like Carvana, Alcoa has no P/E

However, before we get started, this just out concerning Biotech:

From the German Health Minister, no less:

“Permanent Disabilities”

In a way, it does tie into the Alcoa analysis.

As a reminder, the economic (and population) collapse created by protection from ‘The Speck’, will last the lifetime of anyone reading this post (not advice, not a recommendation).

To support that statement and expand on the enormity of what’s happening, we have this link.

‘Over the next 10 years, ‘Speck’ lawsuits are projected to experience tremendous growth.’

With that, let’s move on.

Alcoa & ESG

Just looking at the website, it’s an ESG cornucopia.

When looking at the chart, it’s (almost) a no-brainer.

First, the very long-term view (Quarterly)

Alcoa AA, Quarterly

On the long-term, we have the repeating market characteristic; ‘Spring-to-Up-Thrust.

A ‘test’ of that up-thrust has been occurring over the most recent quarter.

On the weekly chart, we see price action penetrated support with volume increasing.

Alcoa AA, Weekly

Technically, it’s a Wyckoff ‘Spring’ set-up. Some form of upward action next week is to be expected.

However, with the increased volume to the downside, probabilities are low at this point we’ll see any significant upside (not advice, not a recommendation).

Long Way To The ‘Open’

As said in the prior update, events are accelerating. The latest from ZeroHedge proves that to be true.

UBS Seeks Government Backstop As It Rushes To Finalize Credit Suisse Takeover Deal As Soon As Tonight

Another Nail in the Coffin

Looks like the Swedes have put another nail in the coffin for ESG. How long is it going to take for their pension system to fully collapse and then result in social unrest a la Paris?

Stay Tuned

Charts by StockCharts

Note:  Posts on this site are for education purposes only.  They provide one firm’s insight on the markets.  Not investment advice.  See additional disclaimer here.

The Danger Point®, trade mark: No. 6,505,279

Behind The ‘Other’ Door … Biotech

Is The Collapse, Happening Now?

Biotech SPBIO, opened lower and has continued lower throughout the day (with 30-minutes left).

Yesterday, this post showed a potential trading channel. Today’s lower action (higher with inverse LABD) appears to confirm the channel.

We need to be mindful though; events are unfolding rapidly at this point.

We’re just minutes away from market closure and going into the weekend … does anyone really want to be positioned long? (not advice, not a recommendation).

With that in mind, the daily chart of biotech leveraged inverse fund LABD, is shown below with a compressed scale.

The first chart has yesterday’s trading channel.

The second chart is the one of concern.

Biotech SPBIO, Leveraged Inverse LABD, Daily Close

Yesterday’s trading channel

New, potentially more aggressive channel

We’ll get more information on Monday to see if this new channel is in-effect.

There are still about 30-minutes left in the session and anything can happen.

Either way, we’ve already seen the markets ‘lock-up’ with bad quotes, brokerage outages and ‘disappearing‘ bank accounts.

Let’s see what happens next.

Stay Tuned

Charts by StockCharts

Note:  Posts on this site are for education purposes only.  They provide one firm’s insight on the markets.  Not investment advice.  See additional disclaimer here.

The Danger Point®, trade mark: No. 6,505,279

Market Extremes & Channels

Intel and Biotech

It’s the market’s job to frustrate and bankrupt as many participants as possible.

For the highly competitive alpha, the desire to ‘be right’ and catch the absolute turn, overrides any fear of ‘pulling the trigger’.

That fear is for the timid, over-calculating, fastidious type.

Either way, the market attempts to shake-out one side (the alpha trader) or leave the other side behind (the other traders).

Volatility & Price Extremes

So it is with both Intel (INTC), and biotech SPBIO, with its leveraged inverse LABD.

For Intel, today’s action looked like it would never stop and kept screaming higher.

However, if we look at the daily chart, INTC (at this juncture) has failed to post a new extreme daily high.

The chart shows that each recent extreme has been lower than the last (prices approximated).

Intel INTC, Daily

We’ll see if the next session or sessions will be able to penetrate farther to the upside … or if today was the last gasp before heading significantly lower.

For biotech SPBIO, and the leveraged inverse LABD it was a different story, high volatility.

With that sector, the wild price swings do not make it obvious but there’s (as of today) a nascent trend confirmation and trading channel.

SPBIO, Leveraged Inverse LABD, Daily Close

It’s been about six-weeks since the biotech reversal was identified in this post.

A short entry at the location noted (LABD 12.91) would now be yielding an open profit over + 50% (not advice, not a recommendation).

It’s easy to see at this point getting in position later, when it’s obvious, sets one up to get whacked on an adverse move like we’ve had over the past four sessions.

After Hours

With about 30-mintues left in the after-hours session, inverse LABD, is trading higher between 0.50% – 1.0% and INTC is lower by -0.38%.

Stay Tuned

Charts by StockCharts

Note:  Posts on this site are for education purposes only.  They provide one firm’s insight on the markets.  Not investment advice.  See additional disclaimer here.

The Danger Point®, trade mark: No. 6,505,279

Market Update: INTC

‘Negative Waves’

The market’s got a bad ‘vibe’.

It’s possible the latest bank-run scare was only a one-day reprieve.

Chief cook, and bottle washer, Intel (INTC) pushed past the upside area identified in the last update.

It now appears to be in a ‘test and reversal’.

The first chart is the hourly, showing the 50% retrace.

Intel INTC, Hourly

When pulling farther back to the daily, we see the trend line break being tested … today.

Intel INTC, Daily

During yesterday’s session, we have not even got started to the downside and already data vendors were having trouble (network problems) providing market quotes.

As this post is being created (2:05 p.m., EST) Intel continues to pull away from its intraday highs.

Currently trading at INTC 27.63.

Stay Tuned

Charts by StockCharts

Note:  Posts on this site are for education purposes only.  They provide one firm’s insight on the markets.  Not investment advice.  See additional disclaimer here.

The Danger Point®, trade mark: No. 6,505,279

Intel (INTC) Meets Target, Stalls

Off, By Just 0.02-Point

Is downside reversal, next?

The last update on INTC, had this (emphasis added):

“One thing that can be said with some confidence, if INTC reaches 27.25 – 27.50, that puts it at The Danger Point®”

On Friday, Intel posted a daily high of 27.52, just 0.02-points above the projected range.

It closed up by + 2.95% for the day and bucked the overall trend of the markets which were decidedly lower on news of bank failures.

The 15-minute chart has the detail.

Note: A ‘cut-and-paste’ was done on the second chart to show how close price action came to the forecasted area.

Intel INTC, 15-minute

Original analysis

Updated (cut-and-paste) version.

On Friday, price action posted the 27.52-high, right about mid-session.

It retraced lower and then, near the close attempted to move higher again … which so far, has stalled.

Futures, In 4-Hours

It’s just over four-hours before the Sunday futures open.

Unknown of course, is whether or not we’re in the next ‘liquidity event’ a-la 2008 -2009.

If so, not many will be immune and especially not Intel (not advice, not a recommendation).

Intel Chip Factory, Ohio

Much ado is being made about Intel’s major chip factory slated for Ohio.

However, let’s all keep in mind, that projects can be cancelled or abandoned.

One such example for Intel was this one; abandoned in the center of Austin, Texas, for years until it was ultimately demolished.

Stay Tuned

Charts by StockCharts

Note:  Posts on this site are for education purposes only.  They provide one firm’s insight on the markets.  Not investment advice.  See additional disclaimer here.

The Danger Point®, trade mark: No. 6,505,279