BABA … Bull or Bear ?

The Level(s) To Watch

On one hand, BABA, has launched more than 60%, off its most recent lows.

On the other hand, that launch posted the highest daily, weekly monthly, and (about to be) quarterly volume, ever.

Markets tend to come back and test wide bar, high volume areas. Just that probability alone, coupled with the unprecedented volume behavior on four timeframes, points it to the bear side.

Shorting China FXI, via YANG, discussed yesterday (not advice, not a recommendation), is essentially a BABA short as that equity is weighted more than 10%, in the FXI.

So, let’s take a look at what BABA, is saying about itself.
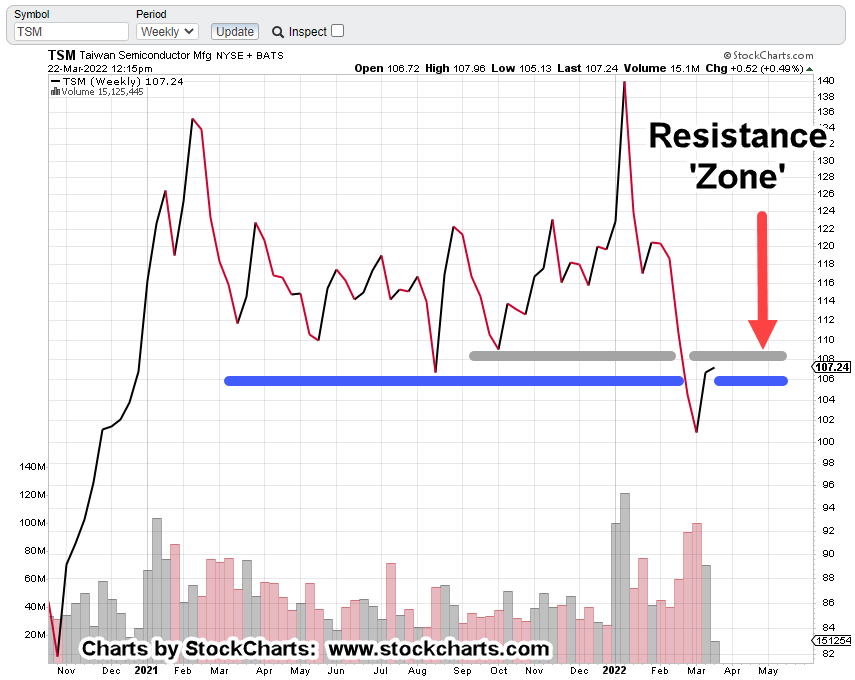
BABA, Weekly Chart

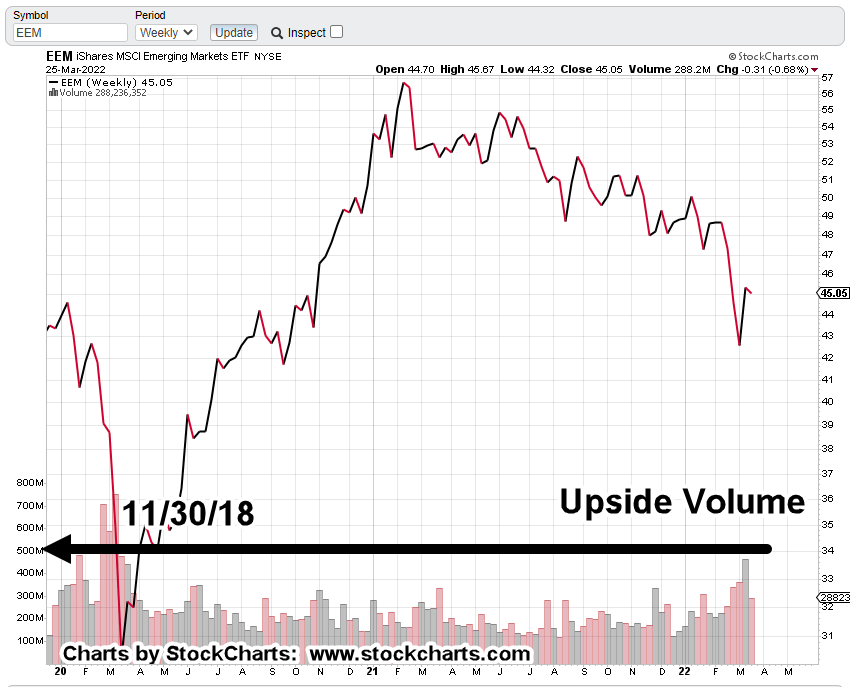
The massive weekly volume highlighted below.

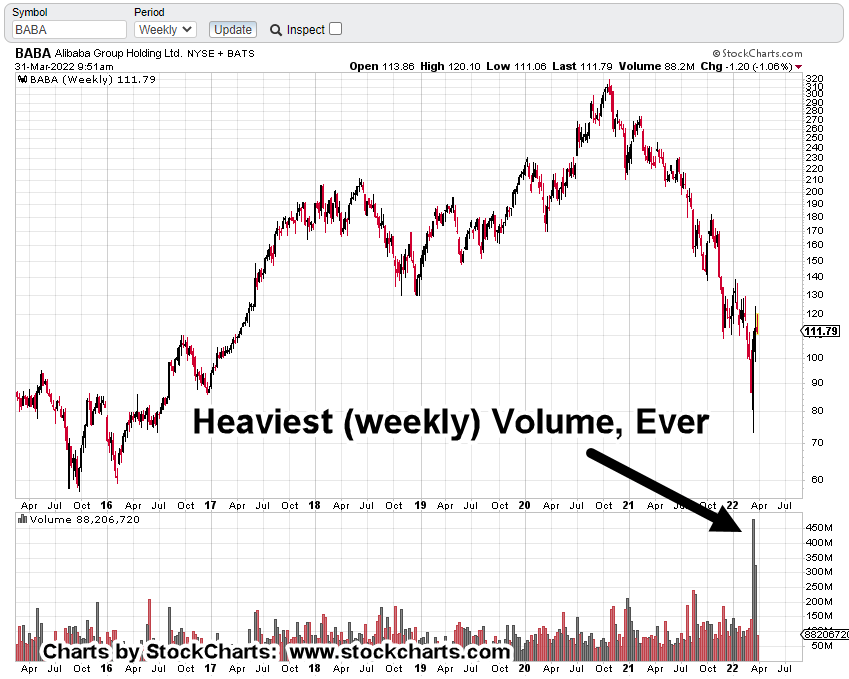
Next, we have a not-so good-looking picture (for the bulls).

BABA may be posting a long-term Head & Shoulders top.

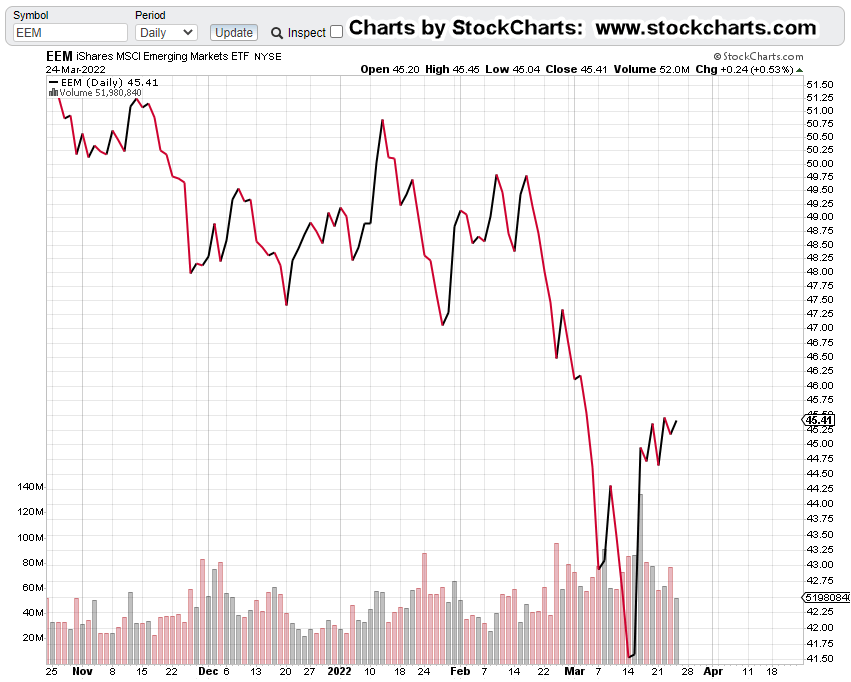
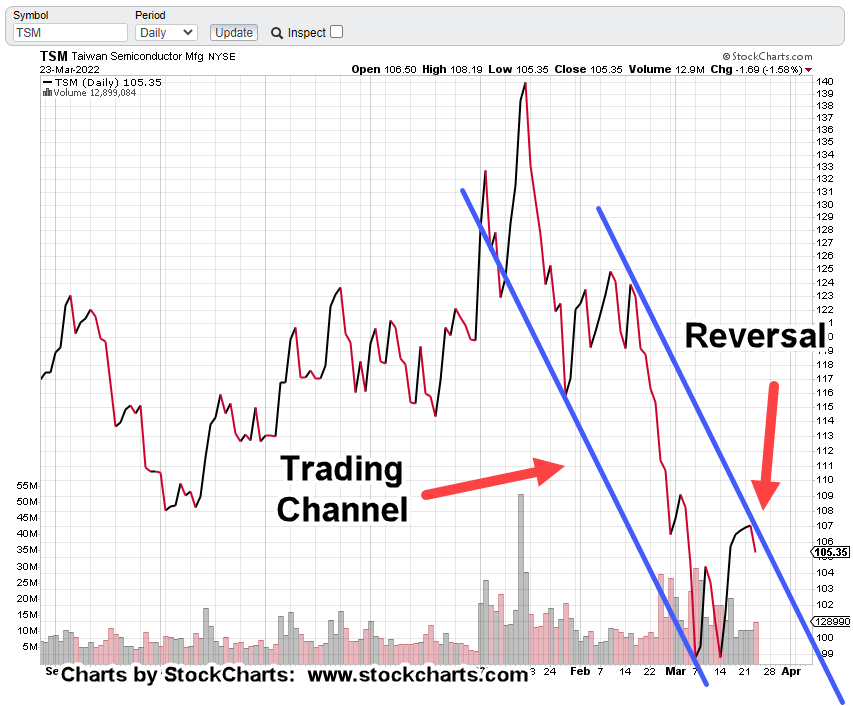
Next, is the daily with its largest volume ever as well.

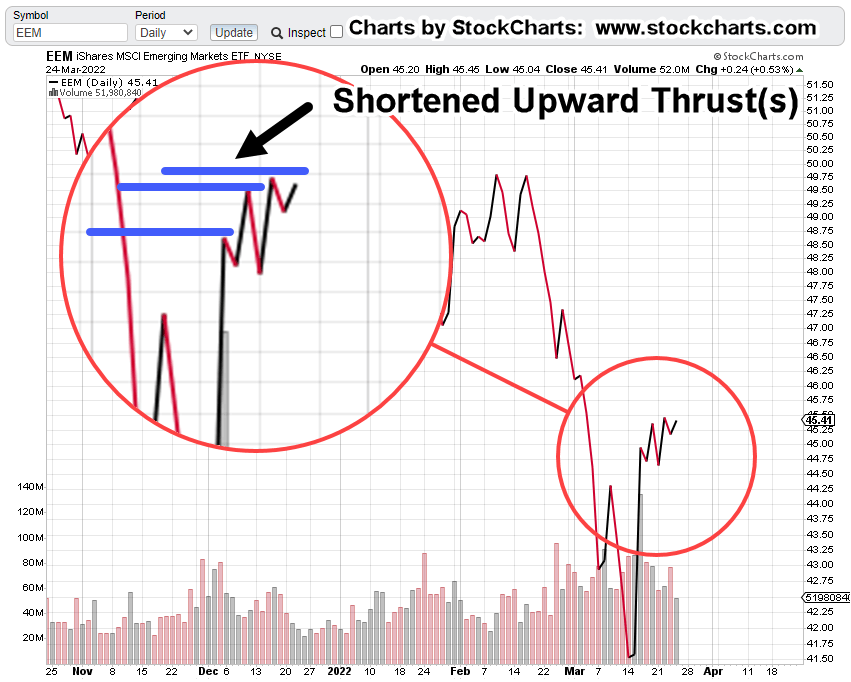
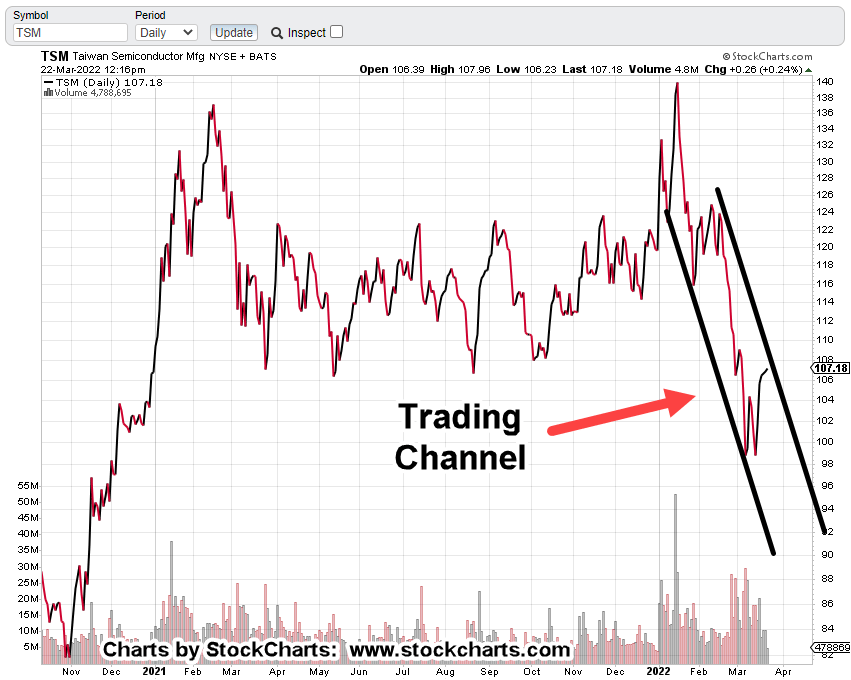
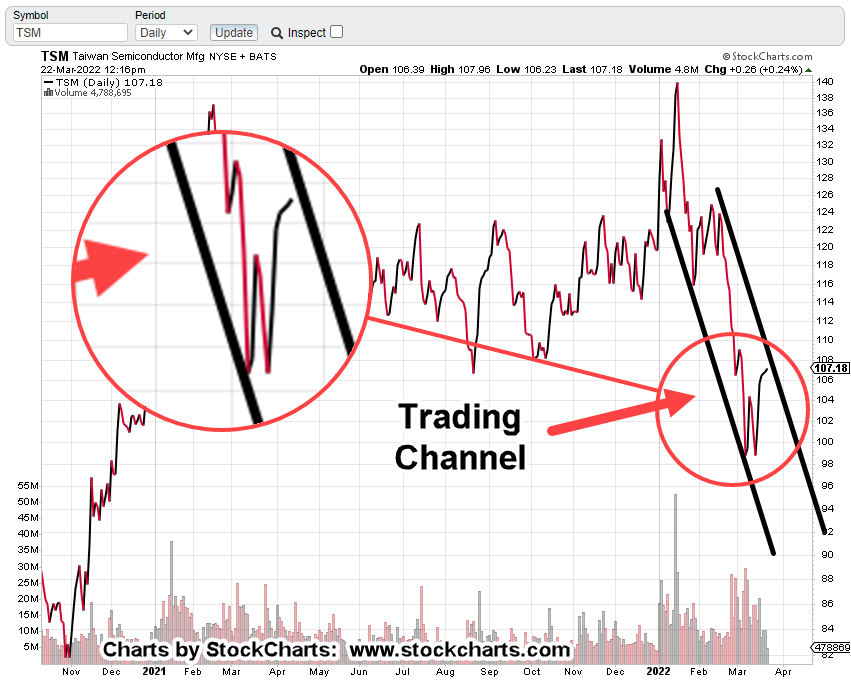
Getting closer-in on the daily, there are support levels to watch.

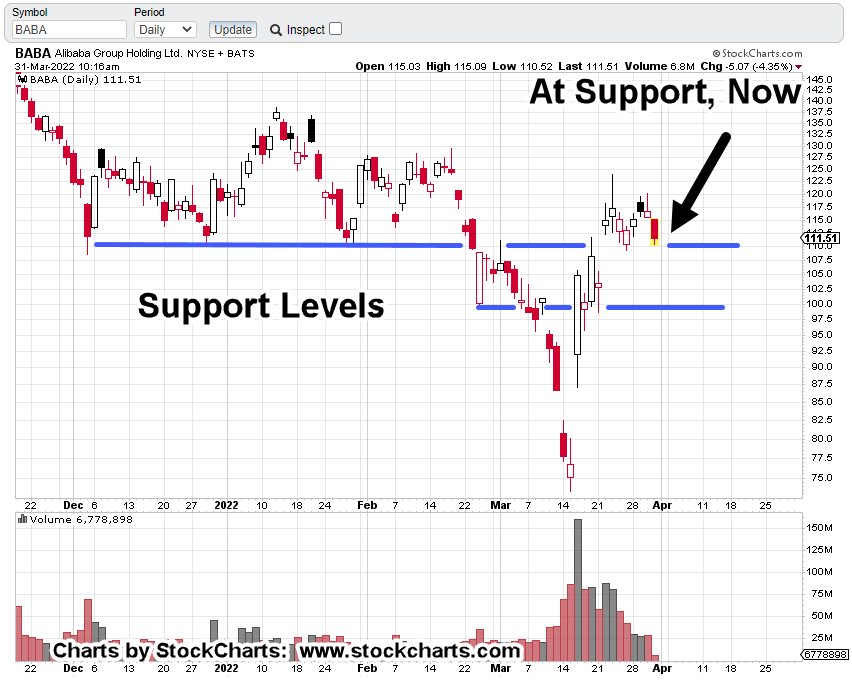
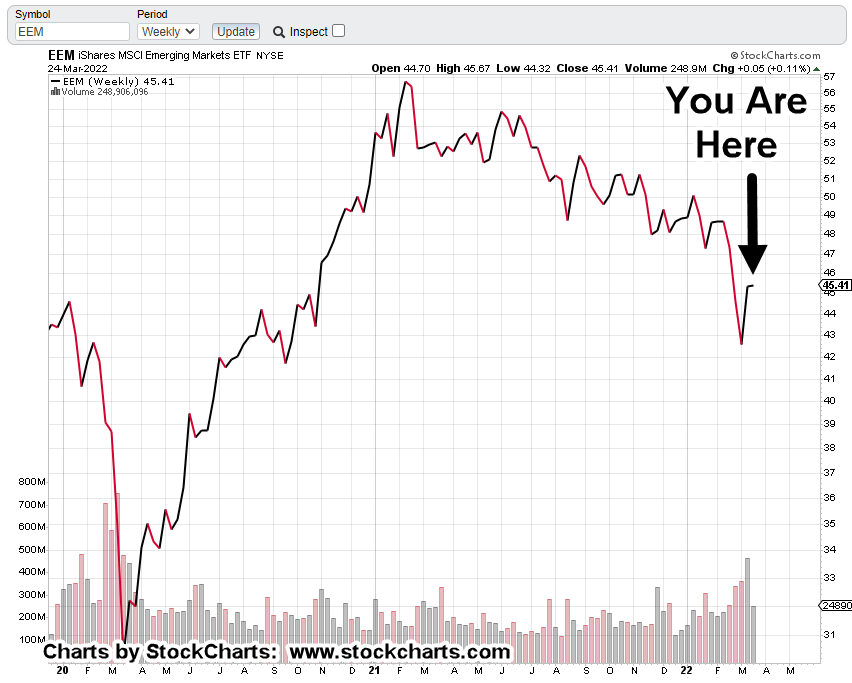
At this juncture, early in this session, we’re at support now. Breaking down puts the next, less defined support into play.

Positioning

The last post, showed what was then current positioning in FXI leveraged short vehicle, YANG (not advice, not a recommendation).

During the session yesterday, the YANG position was increased substantially. Essentially, the low-risk opportunity was used to its fullest advantage.

This method of trading goes way back to Livermore, Wyckoff and Loeb

Livermore:

Focus on the big picture and strategy. Look for the (potential) big move.

Wyckoff:

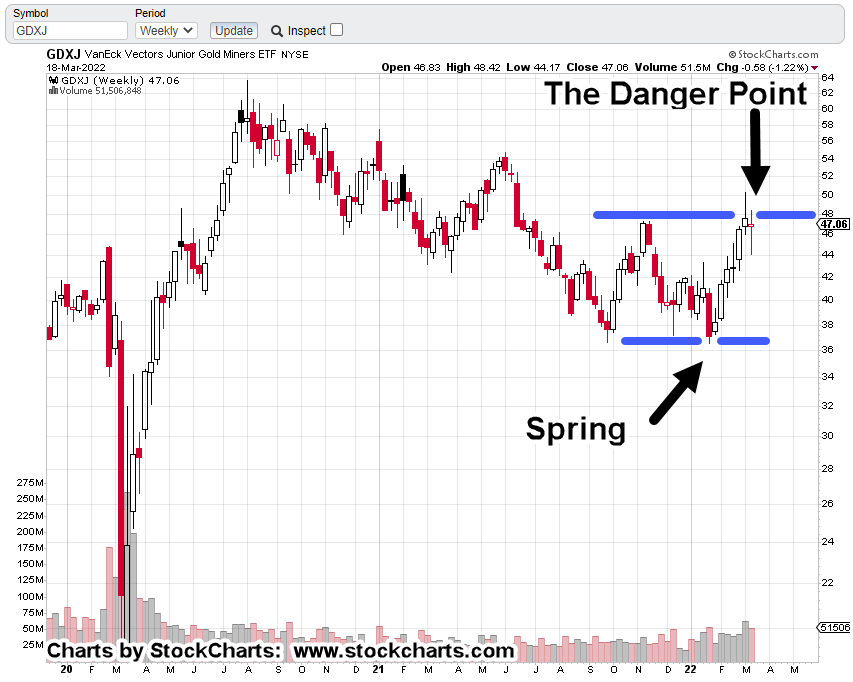
Use what the market is saying about itself to find the danger point. The point of least risk.

Loeb:

Real market opportunities are rare. When one is found, it must be used to its fullest extent.

Do NOT diversify. Focus positions and time the market.

Summary

As always, anything can happen.

BABA is currently at one of its support levels and holding for now … bulls still have a chance.

Obviously, the active trade, YANG-22-01, is taking the bearish stance. The plan is to have a tight, in-the-green stop, soon (possibly today’s low).

As this post stated at the outset, we’ve got all time high volume on four timeframes: Nearly a bearish case in itself.

The high-volume area may be tested.

That means BABA (and FXI) price action would need to move lower to perform that test.

Stay Tuned

Charts by StockCharts

Note:  Posts on this site are for education purposes only.  They provide one firm’s insight on the markets.  Not investment advice.  See additional disclaimer here.

The Danger Point®, trade mark: No. 6,505,279

China, FXI, YINN & YANG

Reposition The Short

‘Once stopped out, the amateur never comes back.’

That’s the assessment from Dr. Alexander Elder, years ago.

The amateur thinks he has special analysis powers and has to be correct on the trade immediately.

On the other, hand, the professional may attempt up to three entries (or more) to get the position they want.

So, it is with Emerging Markets (EEM) and the correlated trade, China (FXI).

Yesterday’s jump higher in both the EEM, and FXI, did not invalidate the work already done, linked here.

Instead, that move told us where to look.

As shown below, the FXI had the least net upward movement. The percentage gains have reduced substantially

FXI, Daily Chart

Using that information, FXI appears at, or near the end of its short squeeze move.

The Emerging Markets trade (once stopped out) was re-positioned to be short the FIX via YANG (not advice, not a recommendation).

YANG, Daily Chart

Upon initial glance, it appears to be a lot of (short) positioning activity. That may be true for now.

However, the objective is to identify a sustainable move (before it’s obvious) and then continue to build on the trade.

Summary

Note how there’s a huge downward slash in YANG, that corresponds to the sharp short squeeze move in FXI.

From a risk standpoint, one way to look at this event, it’s not likely to happen exactly this way again (rule of alternation).

We’re about 20-minutes before the open.

YANG, is trading higher in the pre-market by + 0.25-pts, or about + 1.61%.

Stay Tuned

Charts by StockCharts

Note:  Posts on this site are for education purposes only.  They provide one firm’s insight on the markets.  Not investment advice.  See additional disclaimer here.

The Danger Point®, trade mark: No. 6,505,279

Digging In … Emerging Markets

Uncovering More Evidence

The case continues to build for significant downside in the Emerging Markets, EEM.

This post addressed the shallow 23.6%, Fibonacci retrace; what appears to be completion of short covering.

‘Short covering’ because we’re coming from the view it’s a bear market. A potential slow-motion, train-wreck collapse.

Looking at the chart of EEM, in a different light, the Weekly Close, yet another piece of (reversal) evidence is uncovered.

Weekly Close, EEM

The unmarked chart is below.

For long time users of this site, you already know the drill. Do you ‘see’ the (short) opportunity, the evidence?

Yes, price action’s been in a downtrend for a while and rebounded but there’s more.

The next chart makes it obvious. Long term down-trend support has been broken … and now tested.

Digging deeper with the next chart; to find similar up-side volume, we have to go all the way back to the week of November 30th, 2018.

So, last week’s volume is significant.

However, that volume and price action was only able to get back to the underside of the trend … now turned resistance.

We can include all of the above analysis with previous work.

That work is linked here, here, here and here; adding up to a high probability downside event.

But wait, there’s more.

Digging Up A YouTube, Nugget

Searching YouTube for Emerging Markets, turns up essentially nothing. No surprise, there.

That is, except for this nugget.

The analysis used in the video is different from what’s on this site … and that’s ok.

The probability conclusion is the same, i.e., EEM down.

The takeaway from the video, is the timeframe. If the cycles in the analysis are in-effect (time stamp 8:04), then EEM potentially bottoms-out, in late June or early July.

Summary

The initial short trade via EDZ (EDZ-22-01) was exited, with profit on March 16th.

Another attempt made, on the 17th – 18th (EDZ-22-02) but exited on the 18th, with a moderate loss (-6.5%).

From the 22nd – 24th, another position was opened.

EDZ-22-03, currently in the green at +1.9%.

Stop is set at EDZ: 10.55 (not advice, not a recommendation).

Parting Shot

A quick check of ZeroHedge, has the usual suspects out fomenting falsehoods; attempting induce more fear and misdirection of the masses.

Just as Charles Mackay said back in 1841:

“Men, it has been well said, think in herds; it will be seen that they go mad in herds, while they only recover their senses slowly, one by one.”

By the time this (delusional) crowd recovers their senses, the obvious market opportunities will be long gone.

Stay Tuned

Charts by StockCharts

Note:  Posts on this site are for education purposes only.  They provide one firm’s insight on the markets.  Not investment advice.  See additional disclaimer here.

The Danger Point®, trade mark: No. 6,505,279

The Taiwan Connection

Eyes On The Prize

Huge truth bombs from a just released Stew Peters broadcast, linked here.

At time stamp 15:25, one of the major truths is Taiwan; specifically, Taiwan Semiconductor, TSM.

Why Taiwan?

Why focus on Taiwan Semi and its connection to the Emerging Markets, EEM, ETF?

We’re focused on it because that’s what the tape itself is telling us to do. The EEM, has already been in a sustained downtrend since mid-February, last year.

It’s been three successive (chart) quarters of lower lows and lower highs.

Looking at semiconductors in general, out of the top ten market cap equities in the SOXX, only TSM, is at or below its 23.6% retrace level. All others have rebounded much higher.

As Wyckoff said a hundred years ago … ‘somebody always knows something.’

Meaning, those really in charge (time stamp 2:53, above) already know the plan; their actions show up on the tape.

We’ll look at those tape actions with TSM below

Taiwan Semi TSM, Daily Bar

Moving closer in on the daily, we have the following.

It’s clear, at this juncture, price action has stalled.

Two sessions ago (Wednesday, 23rd) there was an outside down (reversal) bar.

This session and yesterday’s, have been inside action so far.

There has been no new high or low, posted.

Although today’s action posted below yesterday’s low, it has not posted (currently, at mid-session) below the reversal low.

Summary

Anything can happen.

Price action, TSM could launch upward past the resistance and continue to a 38.2%, retrace.

At this point, it seems to be low probability; all the good news (i.e., the short squeeze), may be out.

We’re heading into the weekend and we’ve seen over and again, that’s when things go sideways.

As Livermore said, ‘surprises tend to happen in the direction of trend’.

TSM, is and has been, testing the underside of its breakdown; it now appears poised to continue lower.

Stay Tuned

Charts by StockCharts

Note:  Posts on this site are for education purposes only.  They provide one firm’s insight on the markets.  Not investment advice.  See additional disclaimer here.

The Danger Point®, trade mark: No. 6,505,279

Emerging Markets, Bounce Top ?

At The Danger Point

Emerging Markets (EEM) price action has stopped dead.

As we’ll see below on the Weekly Close chart of EEM, there was a huge run-up last week.

This week’s different as the upward move has (at this juncture), come to a halt.

Emerging Market, EEM Weekly Close

It may be tongue-in-cheek, but the arrow shows that so far, there’s been essentially no upward progress this week.

Looking at the un-marked daily close, we have this.

Expanding the last several trading sessions, the upward net moves have become shorter.

Today, price action failed to close at a new (bounce) high.

Volume also contracted -32.5%, from the previous session and gives clues we may be at or near a top.

Summary

If EEM’s price action is slowing down on the upside, then leveraged inverse EDZ, is slowing down on the downside.

Compared to last week, this week has been very quiet.

As said in other posts, a 23.6% retrace is rare.

However, if EEM reverses from this point, confirming the top, then downside opportunity is likely to be significant (not advice, not a recommendation).

Stay Tuned

Charts by StockCharts

Note:  Posts on this site are for education purposes only.  They provide one firm’s insight on the markets.  Not investment advice.  See additional disclaimer here.

The Danger Point®, trade mark: No. 6,505,279

Taiwan Semi … Reverses

The Market Leads The News

Price action leads the news, not the other way around.

The last update on TSM had this:

“A reversal away from this area confirms the channel and weights probability to more downside …”

As seen in the chart of TSM, a reversal is what we’ve got.

TSM, Daily Close

Note that volume increased on the reversal; helping to confirm the channel.

If this reversal ‘sticks’ and TSM continues lower, the downside potential is significant.

Summary

It’s a no-brainer to assess the world situation as unstable.

It’s exactly during these (once in several generation) events where international borders (for example) like Taiwan and China could potentially change.

Several links of interest on China/Taiwan are below.

China ‘There by tomorrow

Tencent shares plunge

Hong Kong … mandatory tests

China mandates ‘zero policy

China lockdowns to disrupt supply chains

What could go wrong ?

As Livermore said nearly a century ago … ‘surprises tend to happen in the direction of trend’.

Stay Tuned

Charts by StockCharts

Note:  Posts on this site are for education purposes only.  They provide one firm’s insight on the markets.  Not investment advice.  See additional disclaimer here.

The Danger Point®, trade mark: No. 6,505,279

Taiwan Semi … At Resistance

Testing The Underside

Trading Channel

Weekly Close, TSM

Starting with the weekly close of TSM below, we can see the recent top, breakdown and now test.

Closer-in on the next chart, the market’s testing resistance.

Looking at the daily close, it gets more intriguing.

Daily Close, TSM

Looks like TSM’s at the right edge of a downward channel.

Zoom-in

A reversal away from this area confirms the channel and weights probability to more downside (not advice, not a recommendation).

Summary

Taiwan Semi (TSM) is the largest cap in the Emerging Markets, EEM.

Leveraged inverse of the fund is EDZ.

If we get a reversal in TSM this session or possibly next, it may affect the overall emerging markets sector, dragging the EEM down as well.

Unless the tone changes (U.S. and world), meaning that volatility would have to subside, price action behavior at this juncture, suggests it’s a bear market.

Stay Tuned

Charts by StockCharts

Note:  Posts on this site are for education purposes only.  They provide one firm’s insight on the markets.  Not investment advice.  See additional disclaimer here.

The Danger Point®, trade mark: No. 6,505,279

From Gold … To Crypto

Herding Towards The ‘Beast’

Are assets flowing out of gold, into Crypto?

Time stamp 9:27, at this link, Kyle Bass gives his perspective on why the precious metals (along with equities) have not launched higher.

‘People moved to other assets’

Insanity seems to be the go-forward behavior of what’s happening world-wide and in the markets.

Who knows how long the delusion(s) will last?

All it might take, is one major ‘Carrington Event‘, Coronal Mass Ejection to rip the mask off Crypto; just as this link has done with the truth of ‘The Speck’ protection.

From a predictive programming standpoint, it’s interesting the typical symbol for crypto, the most popular ‘Bitcoin’, is colored gold.

Which brings us to the actual chart of gold (GLD).

Gold (GLD) Weekly

From a Wyckoff, tape-reading approach, we have to trust what the chart is telling us.

That is, gold has reversed.

Earlier posts on gold and the miners have effectively stated, there’s no more ‘fear’ to be had save an outright nuclear detonation.

If that happens, it’s doubtful that anyone will be running to the gold market for protection.

Does everyone have Potassium Iodide tablets? If there’s an ‘event’, they’ll be worth their weight in gold (literally).

The Noose Tightens

Constriction, elimination of the food supply (along with everything else) continues and is accelerating.

Fortunately, or unfortunately depending on perspective, we’re watching a potential major opportunity unfold.

That is, the opportunity to acquire hard precious assets when (nearly) everyone else liquidates.

Gold to Crypto

Is that even possible?

Would gold (and miners) be sold off to buy Crypto?

According to Kyle Bass in the link above, it’s already happening and has been for a while.

From a ‘beast system’ standpoint, it makes perfect sense, going from the pure (i.e., gold) to man-made, corrupt.

Junior Miners, GDXJ

The last post showed GDXJ, at the danger point.

This (juniors) sector seems to be the most sensitive to metals fluctuations. So, we can use it as a leveraged proxy for the overall market.

One has to wonder what kind of ruse will be created to have the masses dump their precious metals ‘stack’ and panic into crypto.

Stay Tuned

Charts by StockCharts

Note:  Posts on this site are for education purposes only.  They provide one firm’s insight on the markets.  Not investment advice.  See additional disclaimer here.

The Danger Point®, trade mark: No. 6,505,279

Gold Up … Miners Down

It’s Not A ‘Miners’ Bull Market

Gold (GLD) is hovering near all-time highs but the miners, especially the Juniors GDXJ, are far below.

What better way to show the disconnect than looking at the weekly close charts for both gold (GLD), and GDXJ.

GLD & GDXJ, Combined, Weekly Close

The next chart has been discussed in prior updates but is repeated here for refrence.

The difference is GDXJ’s, now in up-thrust (potential reversal) position.

Junior Miners GDXJ, Weekly Close

Closer in on the weekly candle chart, we have the following repeating pattern, ‘Spring to Up-Thrust‘:

We’re at the danger point where it won’t take much to see if action is to continue higher or reverse.

The case for reversal is shown on the daily below.

Note the energy of the upward thrusts Force Index, is dissipating (black arrow) while the energy on the downward thrusts is increasing.

GDXJ, Daily with Force Index

Summary:

The Junior Miners are not in a bull market and have not been for years.

They never fully recovered after gold’s decline during the 2012 – 2015, timeframe. In the meantime, they may have posted an ‘a-b-c’ corrective (bearish) price action.

Obviously, there have been upward spasms as has just occurred over the past six-weeks.

Now, it appears we’re at the juncture where action has set probabilities to favor a downside reversal (not advice, not a recommendation).

Stay Tuned

Charts by StockCharts

Note:  Posts on this site are for education purposes only.  They provide one firm’s insight on the markets.  Not investment advice.  See additional disclaimer here.

The Danger Point®, trade mark: No. 6,505,279

Emerging Markets, Pivot Ready ?

Hovering At Resistance

After Wednesday’s huge run-up, Emerging Markets (EEM) is now hovering at resistance.

Reportedly, there’s a Xi ‘Put’, in place to make sure China and related markets don’t go down.

Never mind that Wednesday’s massive EEM, launch had all the looks of a bear market short squeeze.

From a technical standpoint, several items stand out.

First: Price action’s at support (now resistance) that was determined this past February 24th, on (supposed) news of a Russian invasion.

Second: That resistance level (as shown below) is at a Fibonacci 23.6%, retrace. A 23.6%, retrace that ‘sticks’ is rare; markets tend to go at least to 38.2%, or 50%, before resuming their main trend.

Emerging Markets EEM, Weekly

We’ll start first, with the un-marked weekly chart.

The entire leg lower with 23.6%, retrace.

Now, on to the daily timeframe.

It’s important to note, the first hour of trading, EEM posted a new recovery high just 0.03-pts above Wednesday’s high.

Analysis Tip

The market goes where there are orders.

At this point (mid session), there’re not enough orders for EEM to continue significantly upward.

Summary

Risk may have been reduced for a short position via EDZ (not advice, not a recommendation).

If we get an EEM reversal, the shallow Fibonacci retrace indicates extreme weakness and therefore, downside opportunity is significant.

Stay Tuned

Charts by StockCharts

Note:  Posts on this site are for education purposes only.  They provide one firm’s insight on the markets.  Not investment advice.  See additional disclaimer here.

The Danger Point®, trade mark: No. 6,505,279