Where, Would I Put My Stops?

As former floor trader Richie Naso says, ‘You have to think like a criminal’ (time stamp 10:50).
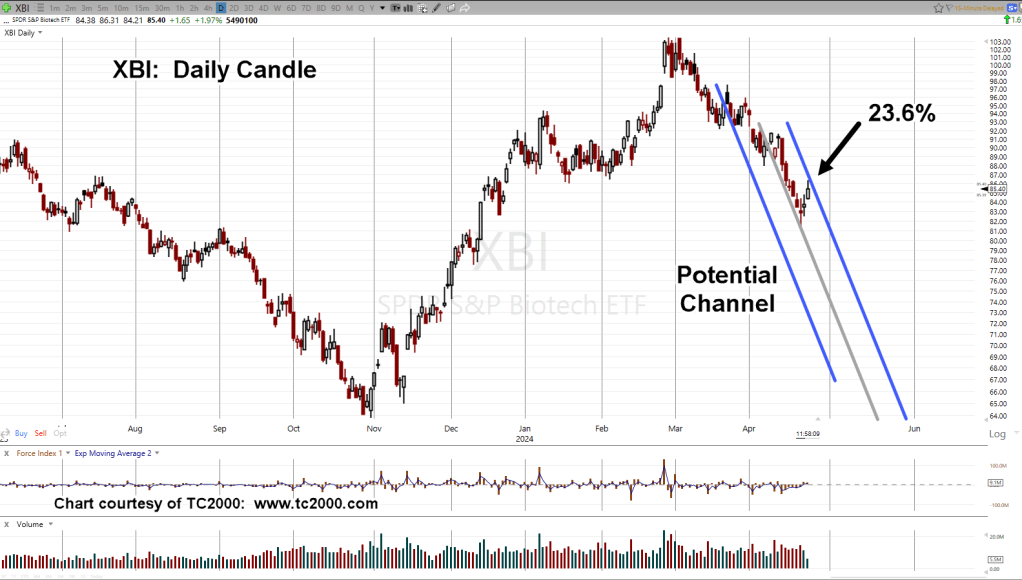
Using his example, a market-maker executes orders ‘to create liquidity’; where on the chart of biotech XBI (below), would that bundle of ‘order’ liquidity exist?
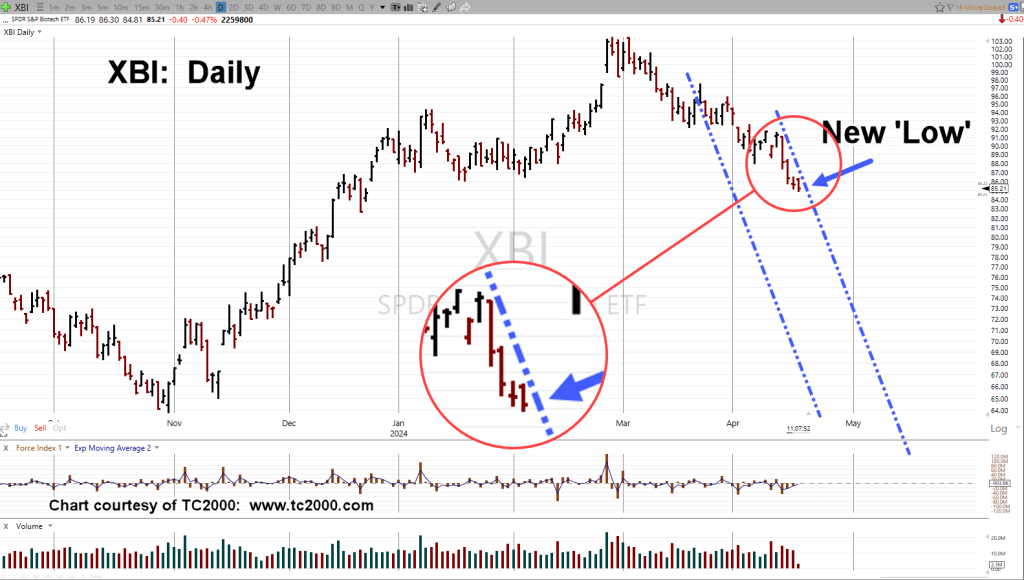
Biotech XBI, Daily
The purple oval shows where there’s a potential of congregated ‘stops’.
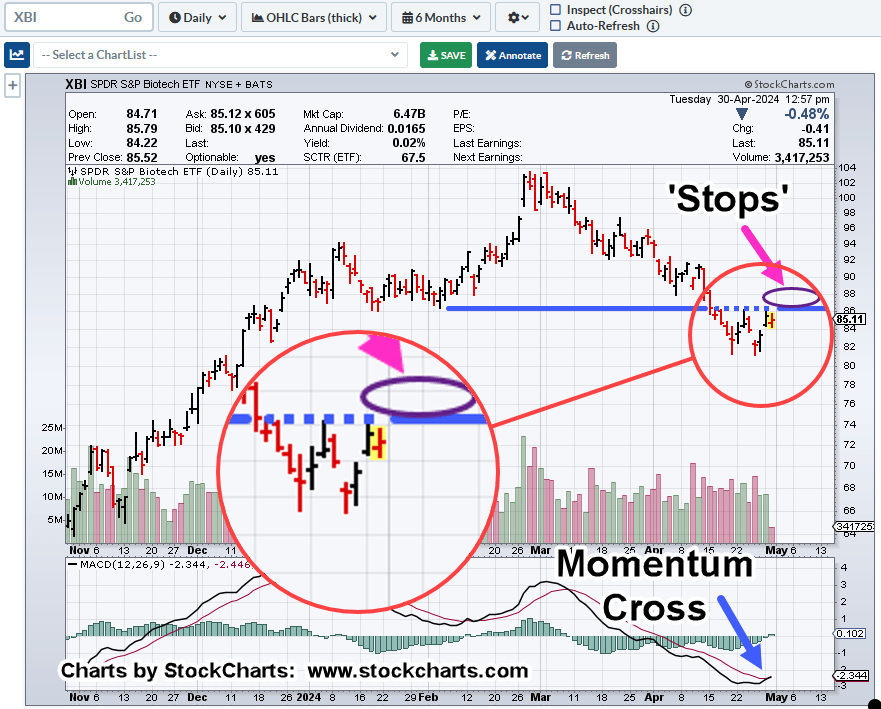
Also note, the MACD cross.
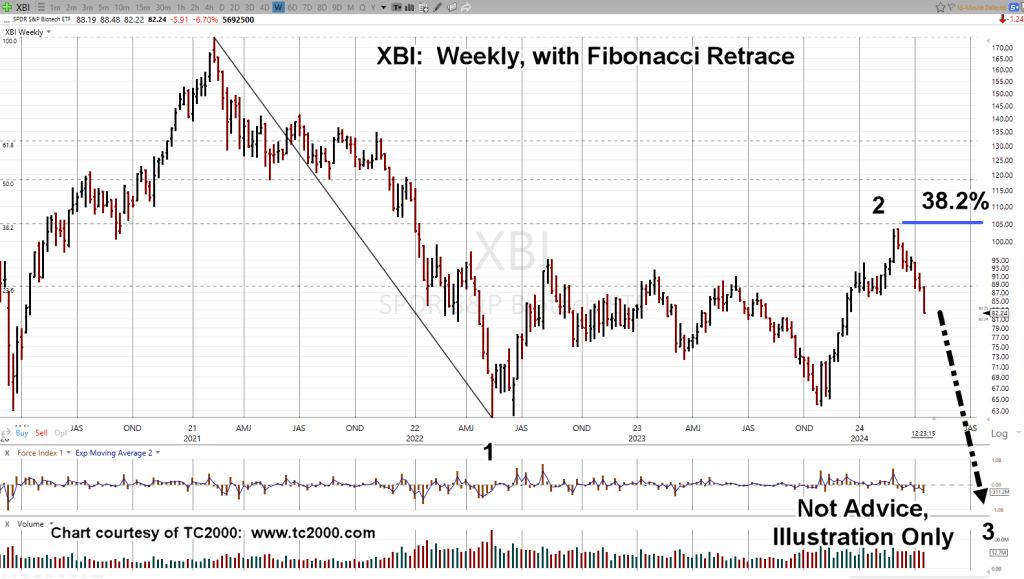
This trigger signal is on the Daily MACD, only as the weekly shows longer term momentum continues lower (not advice, not a recommendation).
At this juncture, XBI has broken out of previous trend channels and so, we have a new construct.
Positioning
Presently, I have no open positions in biotech (not advice, not a recommendation).
Back in the day, I would likely be holding short, placing my stops exactly at the location of the purple oval.
Let’s see if the market searches out my old stop location that if hit, would have taken me out of position (via LABD) right in time for a potential reversal to the downside. 🙂
Reminder, Fed interest rate announcement tomorrow.
Stay Tuned
Charts by StockCharts
Note: Posts on this site are for education purposes only. They provide one firm’s insight on the markets. Not investment advice. See additional disclaimer here.
The Danger Point®, trade mark: No. 6,505,279