Another ‘Depression’ Indicator

Best Buy’s breaking a trendline that’s been in effect since December 1991.
The weekly chart (below) has zoomed-in to the last 13-years or so, showing the magnitude of the breakdown.
While the financial press plies their trade, this just out as the latest effort to confuse whoever is still listening, anyone with two BBY gift-cards rubbing together feels in their gut, we’ve gone straight past ‘recession’ and into ‘depression‘ (not advice, not a recommendation).
The chart of BBY, itself, is telling us there’s been a (potential) massive change of direction.
Best Buy (BBY), Weekly Close
The lower dashed trend-line continues all the way back to December 1991.

The wedge ‘throw-over’ lasted an incredible Fibonacci 21-months, from July of 2020 to the ‘test’ in March of 2022.
Lower price action confirmed that reversal and now, we’re breaking down from the 32-year long formation.
Positioning
From a personal standpoint, I have no plans to short BBY at this time.
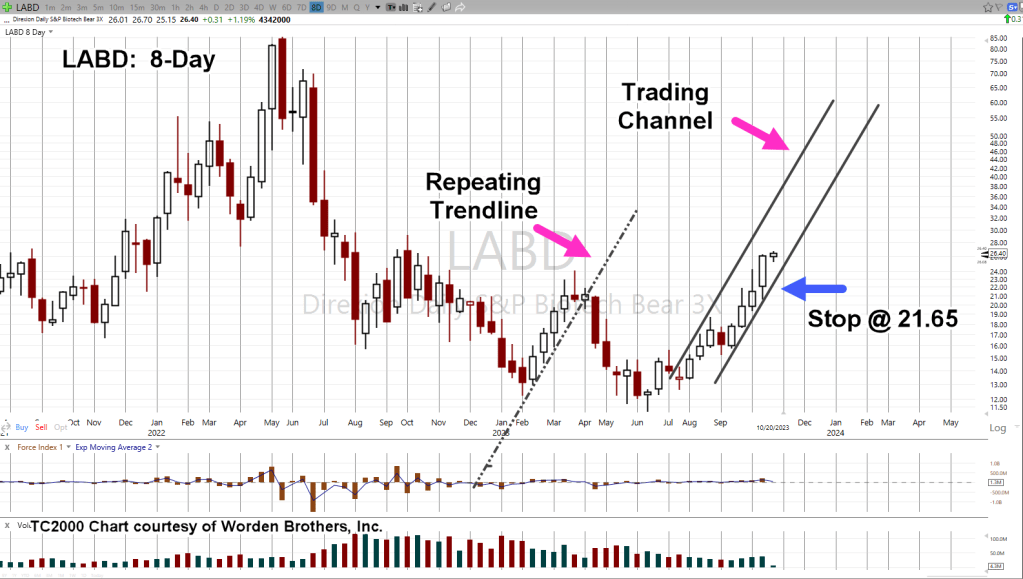
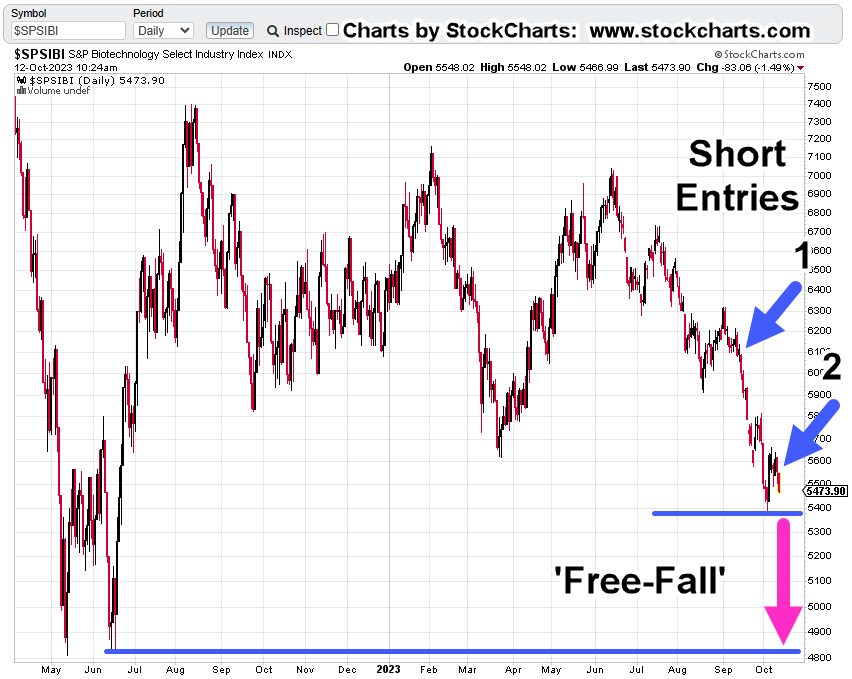
However, BBY price action can, and is being used as confirmation to remain short (of not stopped out) via the biotech trade LABD-23-11 (not advice, not a recommendation).
Stay Tuned
Charts by StockCharts
Note: Posts on this site are for education purposes only. They provide one firm’s insight on the markets. Not investment advice. See additional disclaimer here.
The Danger Point®, trade mark: No. 6,505,279