Note: Posts on this site are for education purposes only. They provide one firm’s insight on the markets. Not investment advice. See additional disclaimer here.
Note: Posts on this site are for education purposes only. They provide one firm’s insight on the markets. Not investment advice. See additional disclaimer here.
We have all kinds of Fed related kabuki on tap for tomorrow, link here.
From a Wyckoff standpoint, whatever the Fed says, the beige book or any other ancillary information, is of no-matter to what the market’s actually saying about itself.
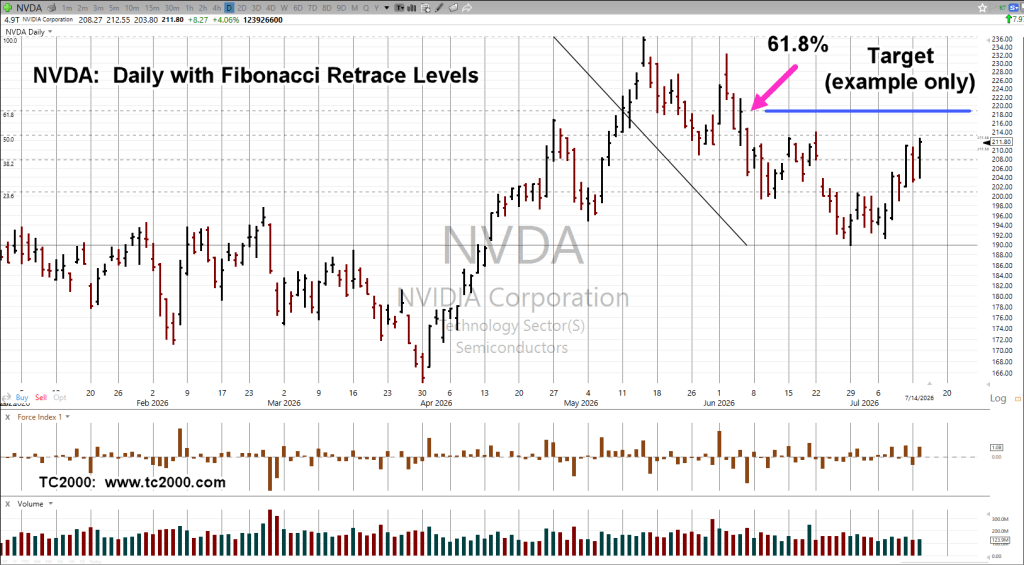
In the case of Nvidia and by correlation, the SOXX, gap distance discussed yesterday, is being narrowed.
Nvidia, NVDA, Daily
With the caveat, in the markets, anything can happen, nonetheless we see if NVDA gets to the target level to close the gap, that level is also a 61.8%, Fibonacci retrace (not advice, not a recommendation).
Note: Posts on this site are for education purposes only. They provide one firm’s insight on the markets. Not investment advice. See additional disclaimer here.
Note: Posts on this site are for education purposes only. They provide one firm’s insight on the markets. Not investment advice. See additional disclaimer here.
Note: Posts on this site are for education purposes only. They provide one firm’s insight on the markets. Not investment advice. See additional disclaimer here.
Note: Posts on this site are for education purposes only. They provide one firm’s insight on the markets. Not investment advice. See additional disclaimer here.
Note: Posts on this site are for education purposes only. They provide one firm’s insight on the markets. Not investment advice. See additional disclaimer here.
Today was Fibonacci Day 13, from the SOXX, all-time highs.
So, we’ll see if the SOXX posts and closes higher or if today was it (not advice, not a recommendation).
From an individual vehicle standpoint, ON Semiconductor is the focus.
The market itself has said it does not like recent acquisition plans. A massive down move, heavy volume (now retracing), may be hiding opportunity for something larger.
Note: Posts on this site are for education purposes only. They provide one firm’s insight on the markets. Not investment advice. See additional disclaimer here.
The last update on silver (here), presented the potential to either levitate higher or continue with downward pressure (not advice, not a recommendation).
Since then, silver (SLV) has declined another -11%; now, as we’ll see, it’s between two Fibonacci projections.
Silver SLV, Weekly
Of course, based on videos like this, we can say that ‘nobody’ expects silver to get below $50/.oz (not advice, not a recommendation).
Note: Posts on this site are for education purposes only. They provide one firm’s insight on the markets. Not investment advice. See additional disclaimer here.
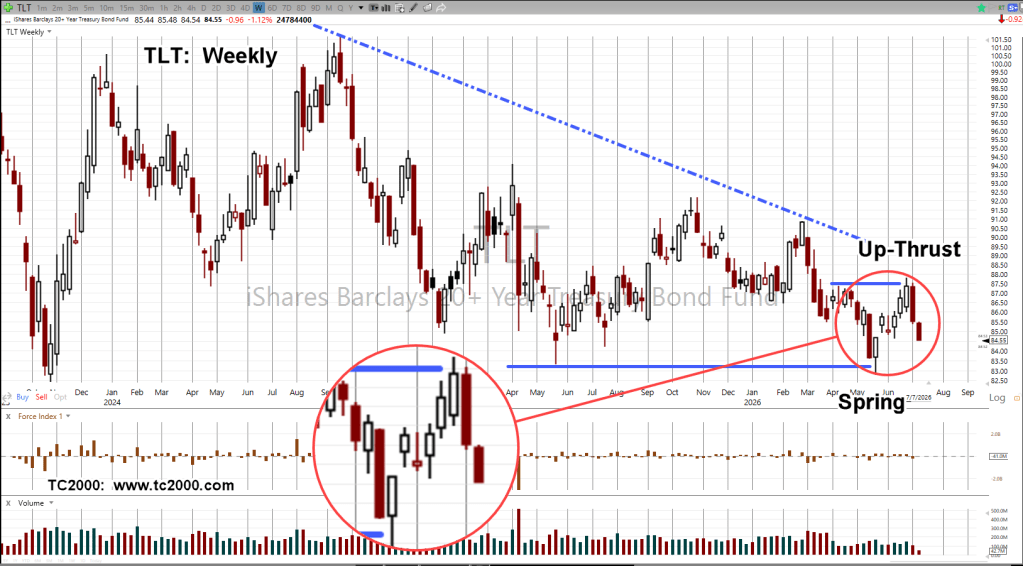
The very next day, TLT launched into a rally, seven straight higher closes, then a minor retrace to 38%, before continuing higher.
It seemed like all was well.
However, this link contains the statement that describes it best (paraphrasing):
Four-decades of the bull market in bonds, steadily declining yields, ended four years ago.
That bull market end, first discussed on this site (over two-years ago), with this post.
All of that to say, we did get a six-week rally in TLT, which at this point, has imploded; the over-riding bear market asserts its trend (not advice, not a recommendation).
Long Bonds TLT, Weekly
Note: The dashed downtrend line goes all the way back to the week of 4/29/22, over four years ago.
Ox Talks, on Bonds
This update from Ox Talks, discussing private credit, but containing a nuance on bonds and interest rates.
‘Retail’ is bailing out of private credit, while ‘institutions’ are taking their place, link here (Time Stamp: 5:18).
At 5:40, we see how those institutions expect to see the ‘investment’ pay off (not advice, not a recommendation).
Note: Posts on this site are for education purposes only. They provide one firm’s insight on the markets. Not investment advice. See additional disclaimer here.