Implosion Continues
Several updates from Michael Bordenaro, link here and here paint a bleak picture for fast-food and the ‘gig’ economy.
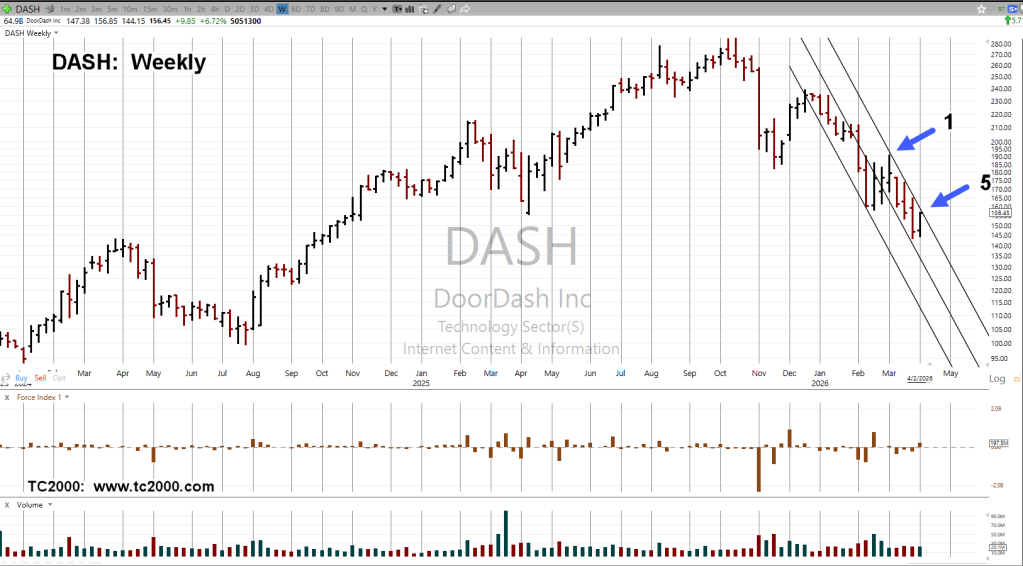
From all-time highs to last Thursday’s close, DASH, is down over 45%.
The chart above, is brief but effective.
It shows a trading channel with price action contacting the right side, a Fibonacci 5-Weeks from the pivot lower (not advice, not a recommendation).
Let’s add, the week labeled as “1”, is also a Fibonacci 21-Weeks from all-time highs.
Stay Tuned
Charts by StockCharts
Note: Posts on this site are for education purposes only. They provide one firm’s insight on the markets. Not investment advice. See additional disclaimer here.
The Danger Point®, trade mark: No. 6,505,279
