Model
Analysis of the Russell 2000 all-time high reversal, 2015 – 2016, model the Wyckoff technique.
Russell 2000 All-Time High Reversal: Probability
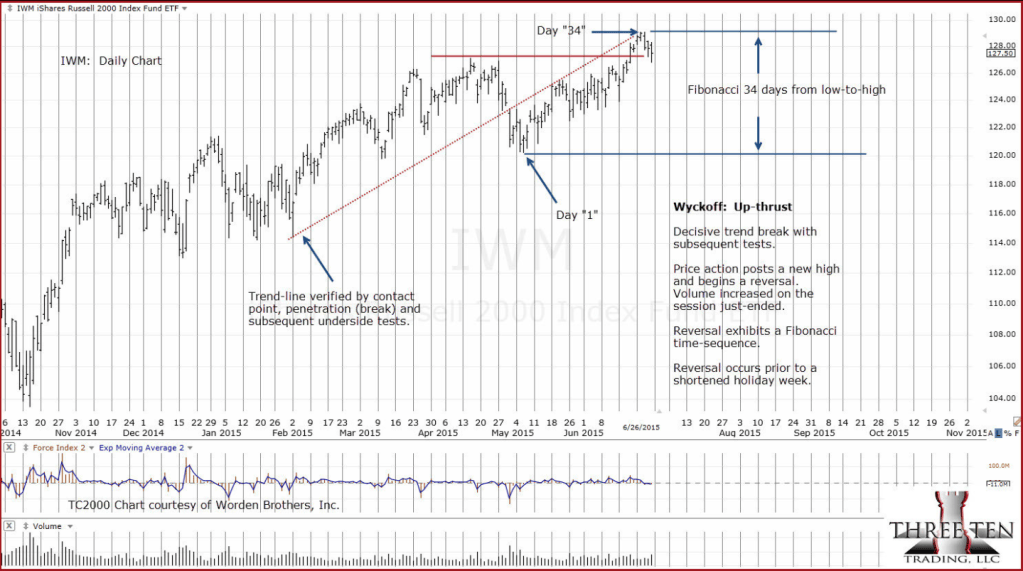
Russell 2000 All-Time High Reversal: Actual
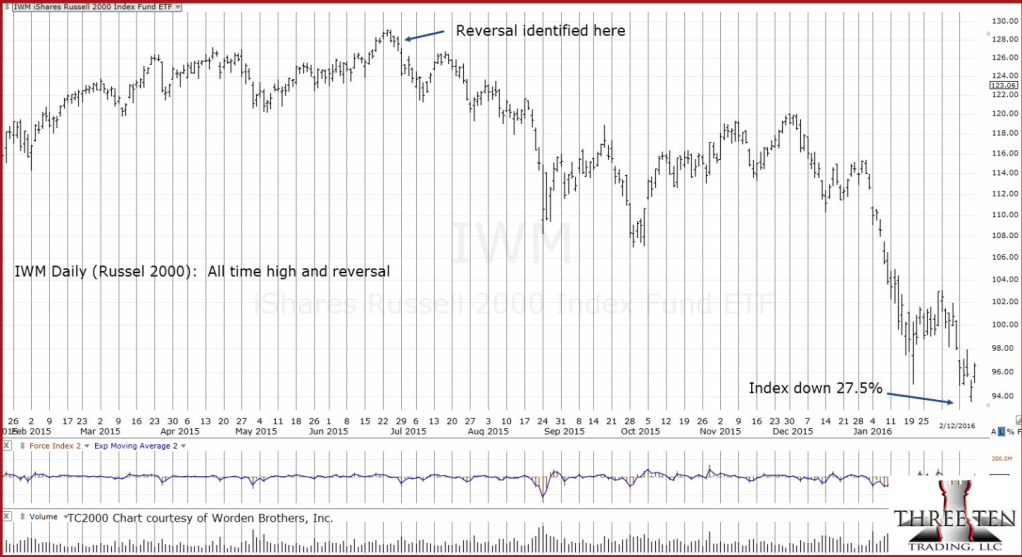
Note what’s in the charts and what is not.
There:
Fibonacci time sequence
Support/Resistance
Price bar, and volume
Trendlines
Empirical data (Holiday Turns)
Experience and intuition … which can’t be quantified.
Not There:
What the Fed is doing.
Any government data of any kind
Earnings forecasts or actualities
P/E ratios or any other ‘valuation’
Target Audience:
Posts are presented to market participants that have moved past the usual suspects of financial distraction(s), i.e., mainstream news, earnings reports, ‘valuations’, and forecasts.
The example above is proof in itself; Wyckoff method focuses strictly on ‘what the market is saying about itself.’
Stay Tuned
Charts by StockCharts, TC2000
Note: Posts on this site are for education purposes only. They provide one firm’s insight on the markets. Not investment advice. See additional disclaimer here.
The Danger Point®, trade mark: No. 6,505,279

