Terminating Wedge

Technically, the short-covering rally appears to be over.
Shown below, there was a minor wedge formed over the past two weeks that has been met with a measured move.
Pre-market action (9:10 a.m., EST) is lower; currently trading below yesterday’s low of TSLA 204.77.
We’ll get to that but first, a look at the forecast created back in November, last year.
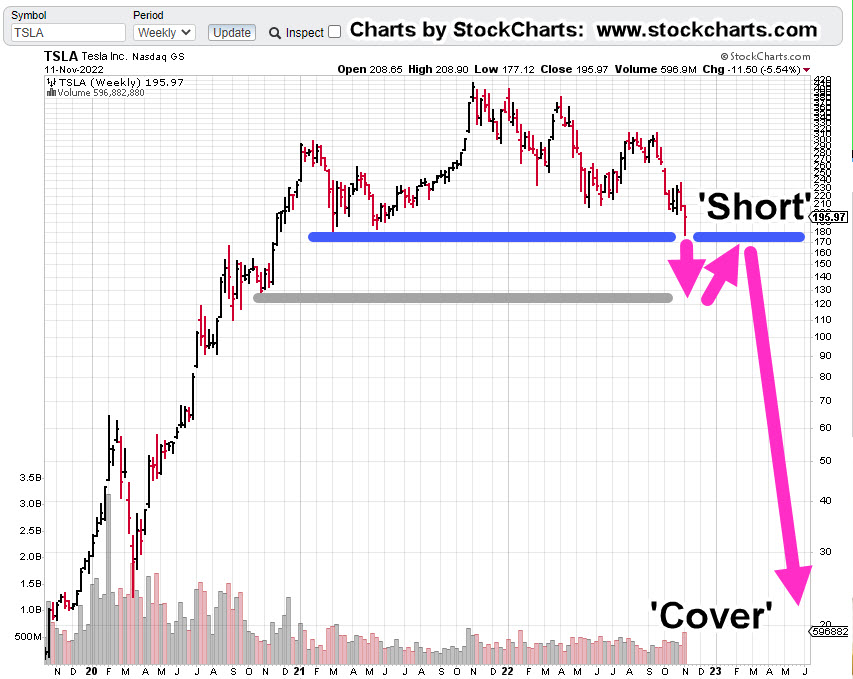
Tesla TSLA, Weekly: November Forecast
Here is the link to the original post.
In that post, note there were two potential outcomes for price action. The charts below show that “Chart 2“, was the course chosen by TSLA.
Original Forecast
And … the result

Let’s move on to the daily and show the terminating wedge.
Tesla TSLA, Daily

It’s important to note that TSLA’s previous decline was ‘well behaved’. That means, it was orderly with few if any significant price gaps.
On the next move down, if it occurs, ‘well-behaved’ is not what comes to mind.
Notice on the short covering rally how there were at least three price-gaps higher … the last of which may be filled at the open today.
Summary & Strategy
We’re in the largest bear market in world history.
There is no sure way to ‘predict’ what will happen next (not advice, not a recommendation).
What can be done, is to identify probabilities.
At this juncture, TSLA appears to have completed its short-covering rally.
It’s now up to the trader/speculator to either stand-aside, or to enter the arena.
Stay Tuned
Charts by StockCharts
Note: Posts on this site are for education purposes only. They provide one firm’s insight on the markets. Not investment advice. See additional disclaimer here.
The Danger Point®, trade mark: No. 6,505,279
