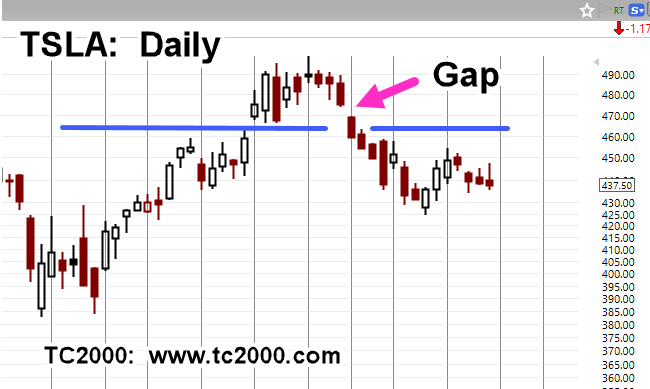
Since price action continues to hover below resistance (blue line), the expectation builds for an attempt to close the gap before, or at, earnings (not advice, not a recommendation).
Note: Posts on this site are for education purposes only. They provide one firm’s insight on the markets. Not investment advice. See additional disclaimer here.
Tesla struggled above resistance, near all-time highs for nine trading days, before reversing lower.
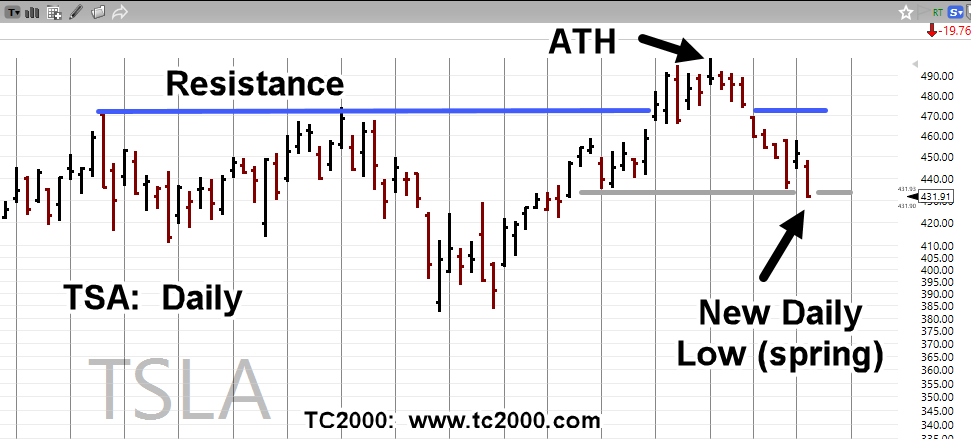
Now, as shown, it’s posted a new daily low … below established support.
Watch price action into the close for a rally attempt; if it happens, risk is narrowed on a short trade, i.e., today’s high (not advice, not a recommendation).
Separately, Uber trade UBER-26-01, was closed out in the pre-market at break-even, before launching higher in the regular session (not advice, not a recommendation)
Note: Posts on this site are for education purposes only. They provide one firm’s insight on the markets. Not investment advice. See additional disclaimer here.
The latest out from ZeroHedge, says that Michael Burry (a.k.a., The Big Short), while claiming Tesla is overvalued (current P/E, 271), does not have a short position.
Adding to the ‘overvaluation’ theme, is deterioration in sales that’s now entering its second year; here and here. Yet, TSLA just made all-time highs this past December 22nd.
In a nutshell, this is the problem with ‘fundamentals’.
Meaning, as far as assessing price action probability, they’re not useful and never have been (not advice, not a recommendation).
A good example of that premise is CrowdStrike (CRWD); with its current P/E, at minus 428. That’s a negative.
When their P/E, is positive, which is not often, we get numbers like 786; yet, the closing price (yesterday) for CRWD was 468.76, with a market cap of 119.4 billion.
How does that even work?
Possibly more entertaining from the ZeroHedge link, are the comments. All kinds of reasons not to short Tesla.
Tesla TSA, Daily
What do you see?
TSLA printed an all-time high on an attempted breakout that has so far, fallen below resistance.
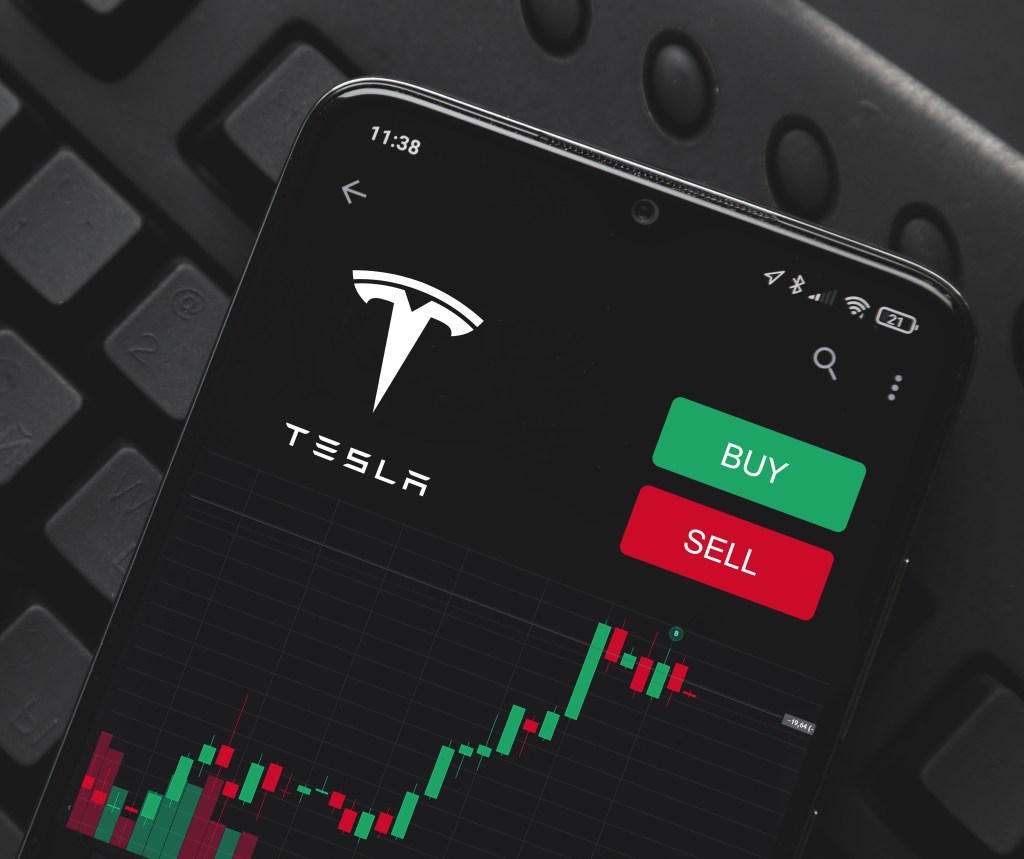
On the sell side, is of course, to short TSLA directly.
Not wanting to be completely exposed to any untoward action, one can short Consumer Discretionary XLY, and effectively short AMZN as well (not advice, not a recommendation).
Note: Posts on this site are for education purposes only. They provide one firm’s insight on the markets. Not investment advice. See additional disclaimer here.
Note: Posts on this site are for education purposes only. They provide one firm’s insight on the markets. Not investment advice. See additional disclaimer here.
Goldman Slashes Tesla Delivery Estimates On Weak Monthly Trends, link here.
All of which feeds into the (EV) supporting side of manufacturing:
Chinese-Owned Firm Halts Construction On Battery Plant In America’s EV Heartland, link here.
Then, on the environmental side, yet another EV fire:
New Footage Shows Abandoned Cargo Ship Laden With Chinese Cars Burning In Pacific, link here.
On the political side, it’s hard to gauge:
Musk Hit Bessent ‘Like A Rugby Player’ In White House Fight, Bannon Claims, link here.
‘Very Disrespectful’: Trump ‘Assumes’ Musk Relationship Is Over, link here.
The reason the politics are important, is because of the subsidies, link here.
On the price action side, we have the following:
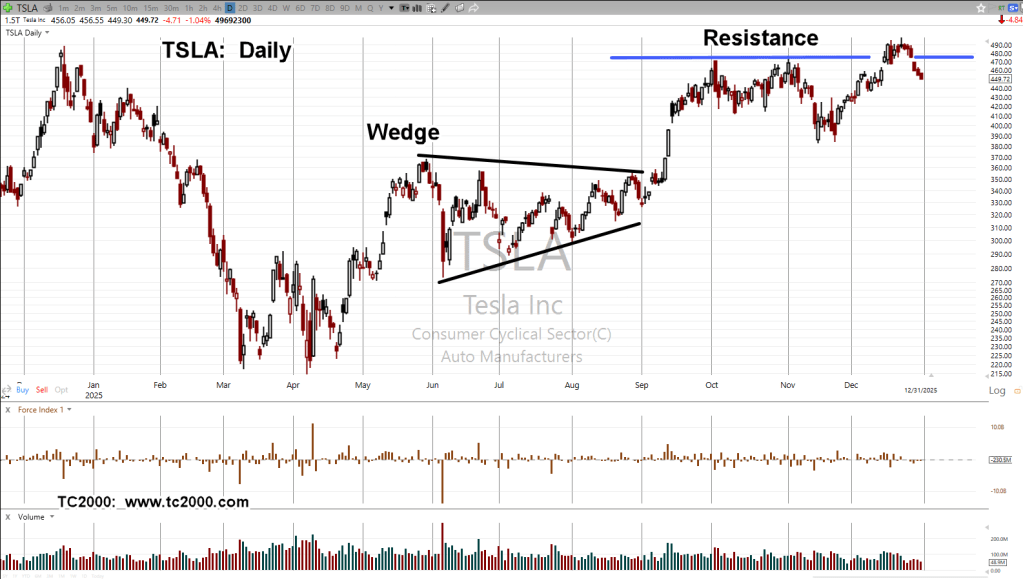
Tesla TSLA, Daily
Pre-market trading (as of 8:56 a.m., EST) is around 315.15, slightly below the 50% retrace level shown.
Unfortunately (for them), the ‘retail’ investor, is telling us where the probabilities lay (not advice, not a recommendation).
Retail Woes
Before we feel sorry for ‘retail’, we’ve all been there at one point. Robert Prechter Jr., said it best when asked, ‘What advice, do you have for the average investor?’
His response was timeless: ‘Stop being the average investor’
What’s Next?
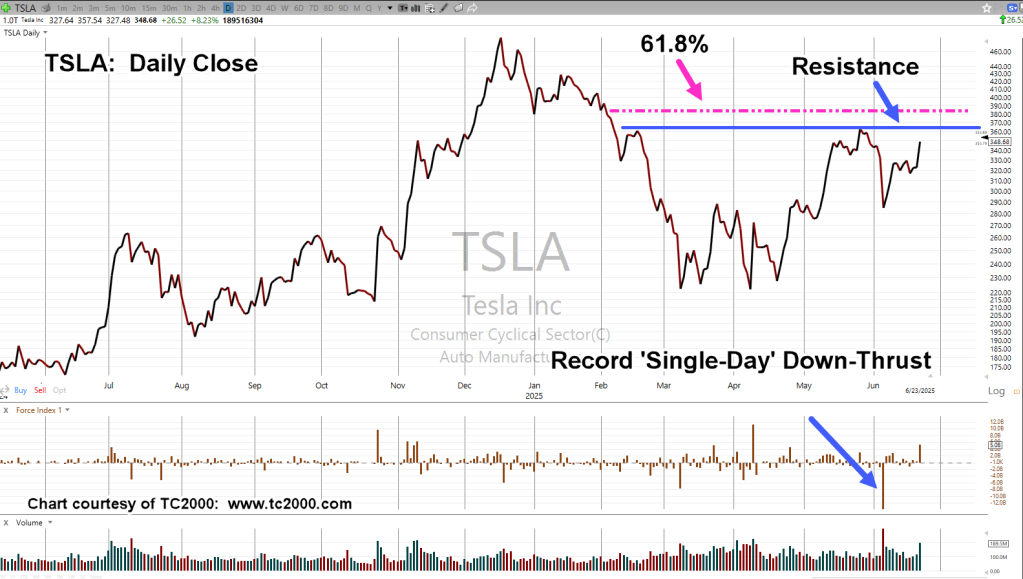
We’ve just had the largest downward force in the history of TSLA, a rebound fueled by apparent desperation, price action at or near the 50% retrace (from the 5/29, highs); the overall probabilities have become clear.
Note: Posts on this site are for education purposes only. They provide one firm’s insight on the markets. Not investment advice. See additional disclaimer here.
It’s likely we’ll know on Monday, whether or not last Friday’s action was a test (and completion) of the up-thrust reversal shown in the chart.
That reversal and potential test, coincides with ‘good news’, ‘bad news’, link here.
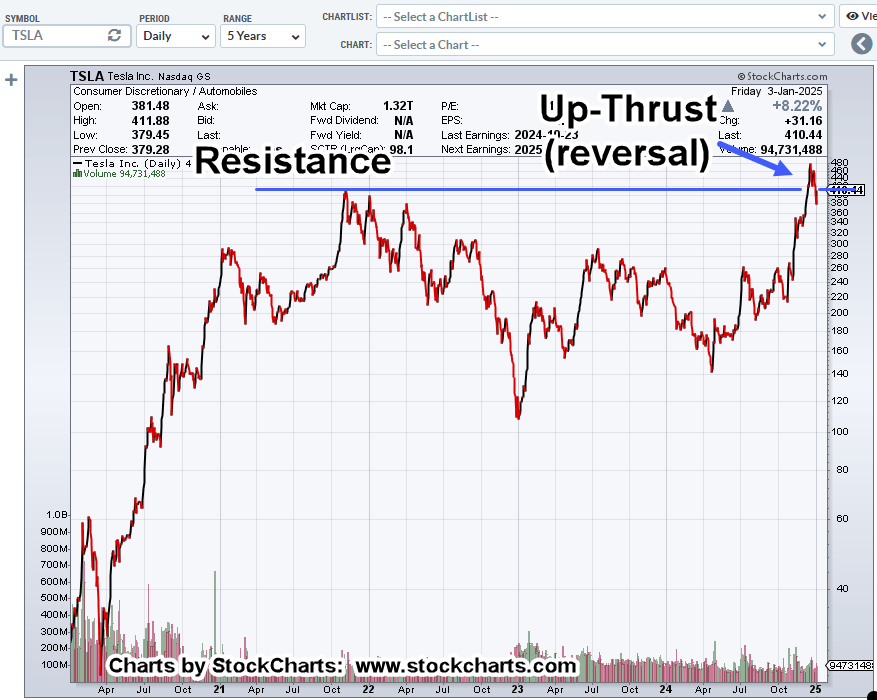
Tesla TSLA, Daily Close
Five years of price action.
Moving in closer to nine months of action.
The ‘resistance’ level goes all the way back to November 4th, 2021, with an all-time high close of 409.97.
Note: Friday’s close of 410.44, was only +0.11%, above the prior (closing) all-time high.
Another Carvana?
Similar to Carvana and its relation to CarMax, i.e., bloated market cap, Tesla has the largest market cap of all (major) auto manufacturers, link here.
Going back to this post on Carvana, volatility reaches a minimum; CVNA, is down a stiff -27.4%, since then.
Note: Posts on this site are for education purposes only. They provide one firm’s insight on the markets. Not investment advice. See additional disclaimer here.
All previous updates on Tesla (TSLA) have been technical, indicating some level of curiosity.
This time, is different.
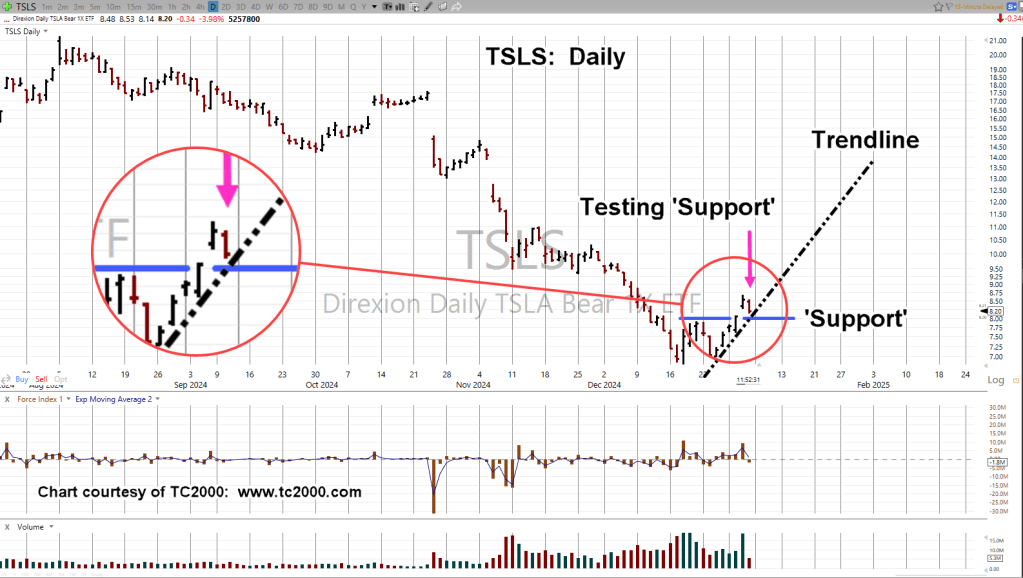
Currently positioned short TSLA, early in this session via inverse fund TSLS (not advice, not a recommendation)
Telsa 1X Inverse Fund, TSLS, Daily
The ‘support’ area shown is actually resistance on the non-inverted chart of TSLA.
As of this post (12:51 p.m., EST), low for inverse fund TSLS is 8.14; if held for the day, it will be the hard stop (not advice, not a recommendation).
Sentiment Warning(s)
Sentiment, Volume, Price; typical model for reversal.
In the case of Tesla, we may have all three (not advice, not a recommendation).
Position(s)
One gets the sense the beginning of this year, has the market sorting itself out.
A brief summary of trade activity for today (not advice, not a recommendation):
DXD-25-01, closed with -1.56%, loss.
TSLS-25-01, opened as detailed above
DUST-25-01, opened … depending on price action, details to follow.
Note: Posts on this site are for education purposes only. They provide one firm’s insight on the markets. Not investment advice. See additional disclaimer here.
Note: Posts on this site are for education purposes only. They provide one firm’s insight on the markets. Not investment advice. See additional disclaimer here.
Let’s go back to the last update on Tesla (TSLA), and see how that analysis is working out:
“Unless we reverse right here and now, Fibonacci retrace and projections (shown below) target the $260 – level for TSLA.”
That was back in early March.
Now, TLSA is currently trading (as of 11:30 a.m., EST) at 246.71, and pushing higher.
The original chart of TSLA, from the March 5th, update is below, followed by current activity.
Tesla TSLA, Daily
Original analysis.
Updated chart (11:15 a.m., EST):
From a trading perspective, TSLA, is being used as a proxy for the market.
That means, if there’s to be a reversal at or near the 259-area, it’s likely the overall market will reverse as well (not advice, not a recommendation).
The ‘Ponzi’ has already been established (the last update). We see the delusion continues with reports like this.
Note: Posts on this site are for education purposes only. They provide one firm’s insight on the markets. Not investment advice. See additional disclaimer here.
The ‘Artificial Intelligence’ (AI) clown show’s in full swing with a ‘predicted‘ single quarter target of $11-Billion, from NVDA.
That’s not to be confused with the budget clown show just ended in Washinton D.C.
And where does that leave Tesla? They seem to be left out of the latest round of cult-like insanity.
Back in the day, Dr. Alexander Elder stated, professionals don’t look for the ‘challenge’ in the markets (trying to figure out the NVDA, top), they look for the ‘money’ … there’s a huge difference.
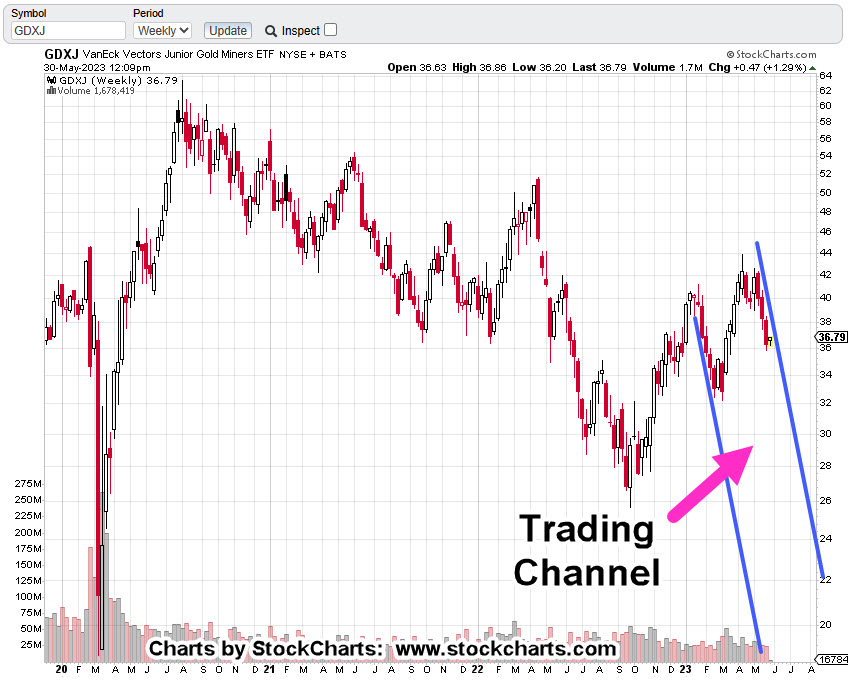
Junior Miners GDXJ, Weekly Candle
As of 12:35 p.m., EST, from a technical perspective, even though we’re up for the day (so far), MACD momentum’s increasing to the downside (magenta arrow).
Nobody seems to be paying attention to gold and silver; all eyes are focused on the next shiny object.
Pulling out a bit farther on the weekly, there’s no question we’re in a channel.
The question is, are we (GDXJ) going to say in that channel or reverse from here?
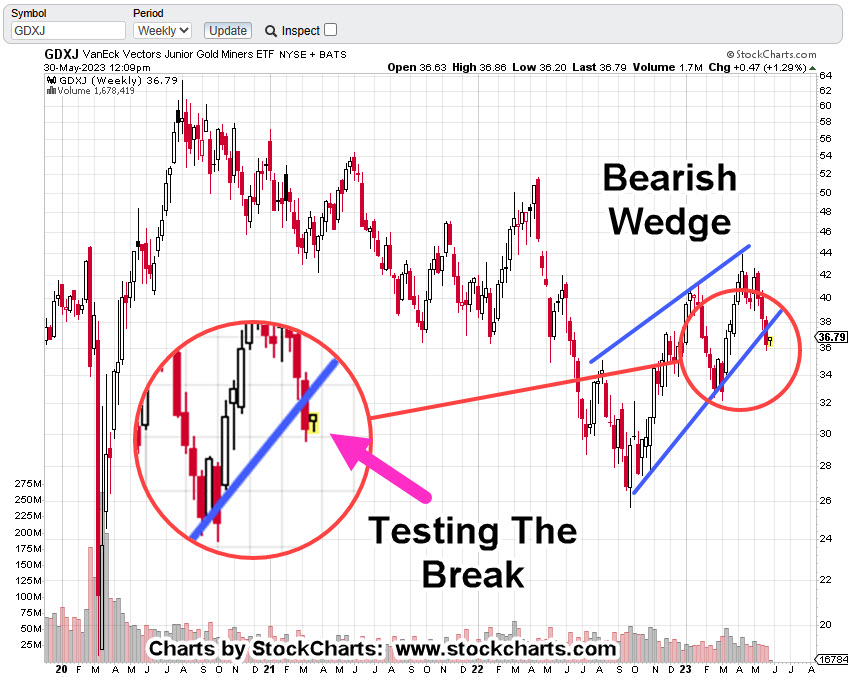
The last update said we’d likely be testing the wedge break and that’s what’s happening.
A ‘test’ will take however long is needed. It’s either pass or fail. Pass in this case is resumption to the downside.
Technical conditions (MACD, wedge break) favor the downside (not advice, not a recommendation).
In addition, we need to keep in mind there’s a new circus in town; the miners may be well on their way to more downside before anyone steps out of the big-top to notice.
Note: Posts on this site are for education purposes only. They provide one firm’s insight on the markets. Not investment advice. See additional disclaimer here.