A False Breakout?

A data-point of one, may not be significant unless that ‘data-point’, is repeated over and over.
That brings us to this link.
Do we have a ‘one-off’ event or is the data point being repeated?
To help answer, this site’s been monitoring what should be one of the fastest selling (used) cars in the market, Toyota Camry.
Scanning the CarMax inventory of Camry’s has the same cars (with minor changes) still for sale, since August, at elevated prices no -less.
Seems to corroborate the link above and makes you wonder what’s (really) happening?
With that, let’s move on to the potential opportunity.
CarMax KMX, Weekly
There’s a lot going on in this chart.”
“What do you see?”
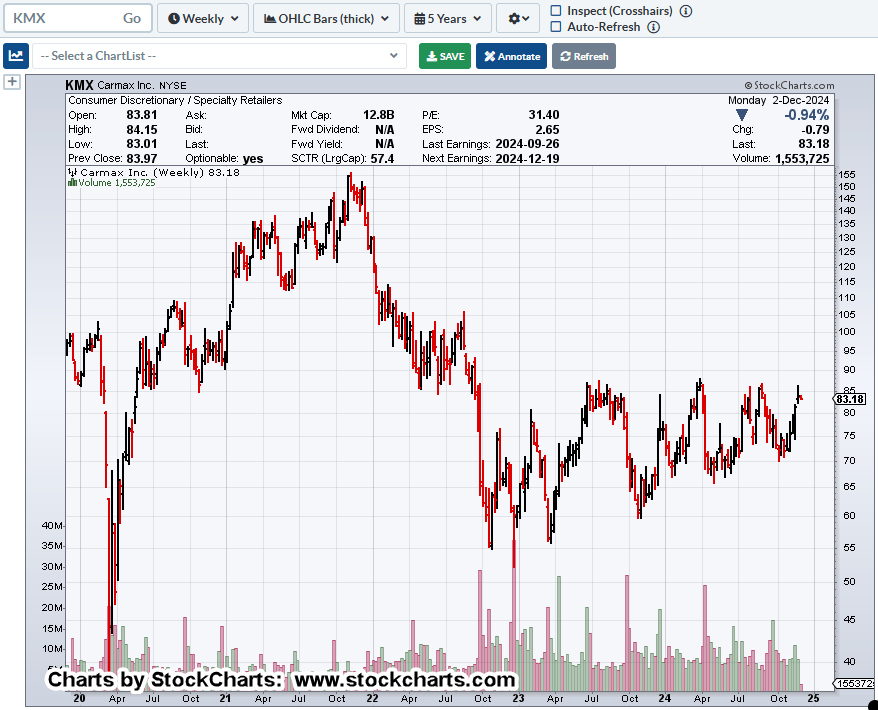
The wedge is obvious.

Maybe a little more subtle until it’s pointed out, huge volume churn since the breakdown during the week of September 30th, 2022.
That’s over two-years of potential distribution.
From a Wyckoff standpoint using his ‘Cause and Effect’ analogy, whatever’s about to happen to KMX, it’s setting itself up for a potential, sustained, long-duration move (not advice, not a recommendation).
Earnings Release
Earnings scheduled for December 19th, before the open.
Stay Tuned
Charts by StockCharts
Note: Posts on this site are for education purposes only. They provide one firm’s insight on the markets. Not investment advice. See additional disclaimer here.
The Danger Point®, trade mark: No. 6,505,279
