Is Tomorrow, The Day?
We have all kinds of Fed related kabuki on tap for tomorrow, link here.
From a Wyckoff standpoint, whatever the Fed says, the beige book or any other ancillary information, is of no-matter to what the market’s actually saying about itself.
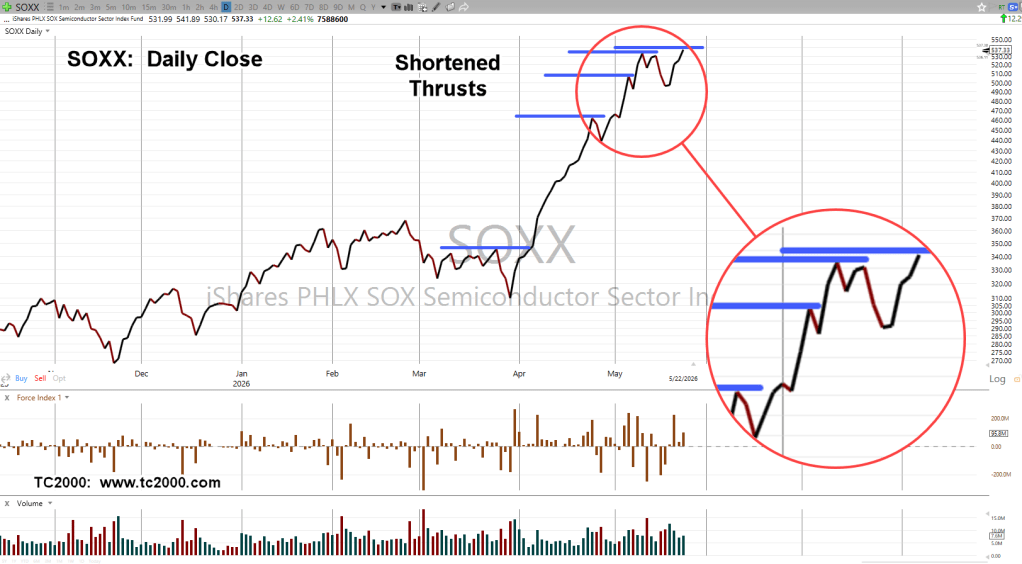
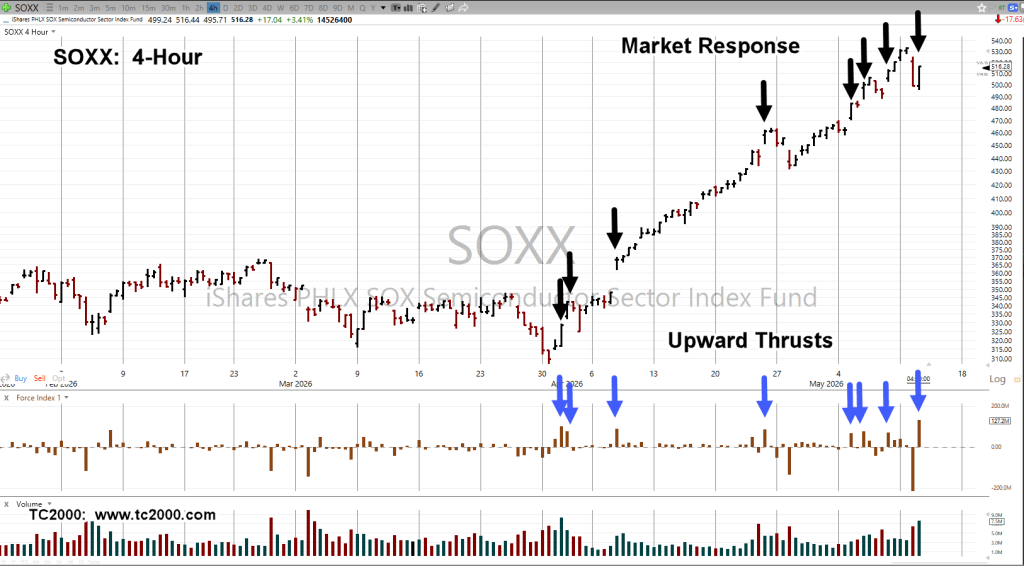
In the case of Nvidia and by correlation, the SOXX, gap distance discussed yesterday, is being narrowed.
Nvidia, NVDA, Daily
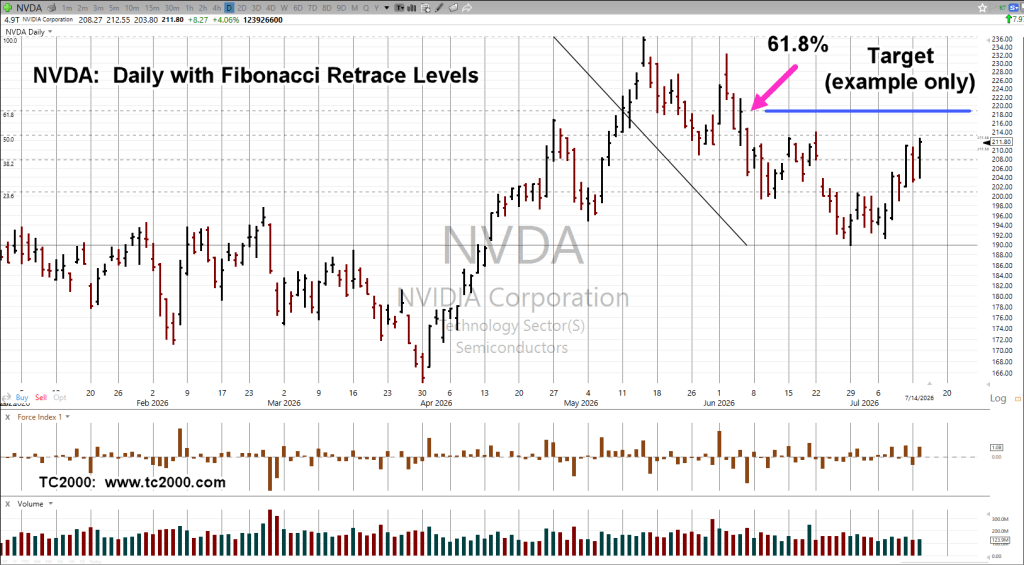
With the caveat, in the markets, anything can happen, nonetheless we see if NVDA gets to the target level to close the gap, that level is also a 61.8%, Fibonacci retrace (not advice, not a recommendation).
Stay Tuned
Charts by StockCharts
Note: Posts on this site are for education purposes only. They provide one firm’s insight on the markets. Not investment advice. See additional disclaimer here.
The Danger Point®, trade mark: No. 6,505,279