It’s thirty-minutes before the open. Dow tracking ETF, DIA is trading lower about one-point or -0.43%.
The inverted chart of DIA, has a wedge breakout.
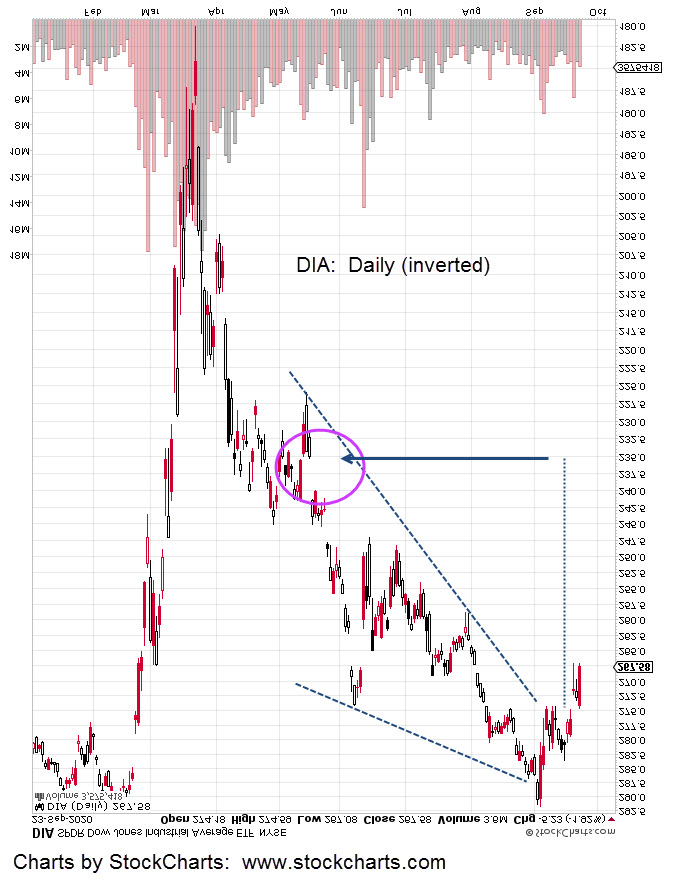
Using traditional techniques for a ‘measured move’, we can project to the 235-area for DIA.
When and if that happens, the Dow will have pushed below significant sepport levels that would then become resistance.
Inverse fund typically used for the downside (not advice, not a recommendation) would be DXD at 2X Inverse.
Charts by StockCharts
