Natural gas trades as a futures contract nearly 24/7. Therefore, the daily chart of UNG is misleading.
Not shown on the standard UNG chart is the most recent low.
That low, in the futures market was right around 7:30 a.m EST on Wednesday, September 31st.
By looking at a chart of UNG, one would think the low for nat-gas occurred today. Not so.
We’ve modified the UNG chart below to represent recent price action on the November contract (NGX20), not shown on UNG.
The low from yesterday’s action is clear. Also clear is today failed to penetrate that low even though a new daily low appears on the unaltered chart of UNG.
In all, it means were at the danger point for natural gas.
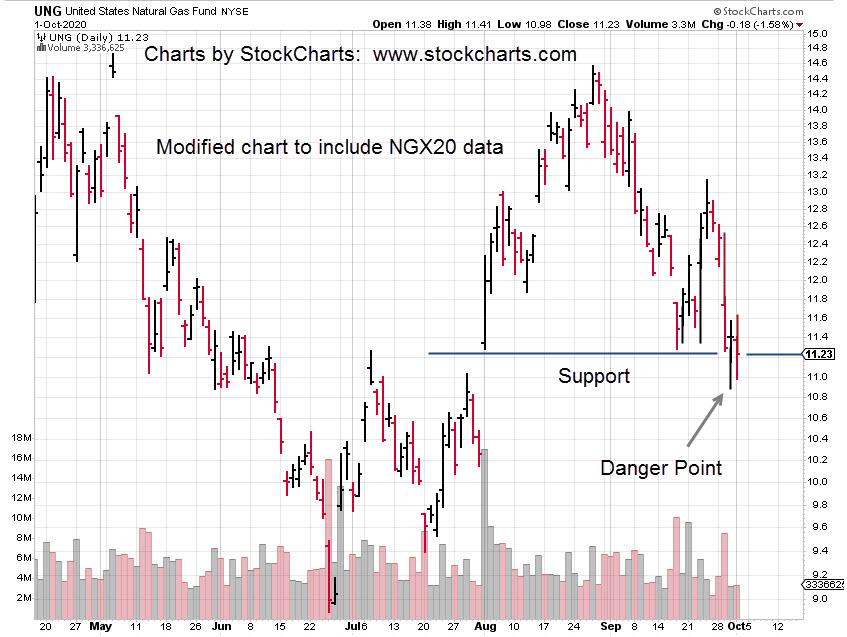
Charts by StockCharts
