Price action has an eerie similarity to August 1987 and the months following.
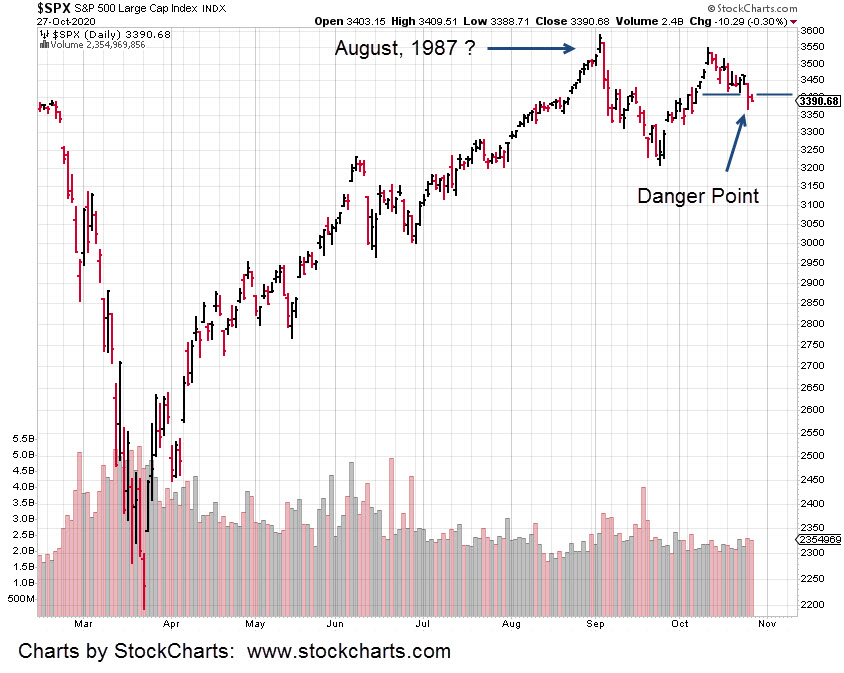
To those old enough … recall how prices just seemed to press higher and higher during the summer months? Stretched, they were.
Then came a break with a move lower. After a while, a few weeks or so, it seemed as if the market was going to make another attempt.
The second attempt did not seem as energetic. Prices continued on though … until they stalled and headed lower.
Just like now?
Continuing on with 1987, price action drifted on down; seemingly with out much fanfare until one day … a Friday there was a huge drop.
That was Friday, October 16, 1987. We all know the action that followed on Monday.
Getting back to the markets at hand:
The last bond update showed a potential bullish set-up.
There’s nothing that says bonds can’t start higher now. In fact, it’s been two up days in a row for TLT.
If TLT penetrates the 160.98, level to the up-side, it’s a classical analysis (not a recommendation, not advice) buy signal on the weekly time-frame.
As of this post (7:01 p.m. EST), the S&P futures are already down -22 points, or about -.65%. Correspondingly, bonds are higher.
Charts by StockCharts

Pingback: The Squeeze Is On « The Danger Point