Last Monday’s update on the Oil & Gas sector ETF, showed it at a confluence of trend-line resistance.

Short positions had been established during that week (on 12/8 and 12/9) using inverse fund DUG; not advice, not a recommendation
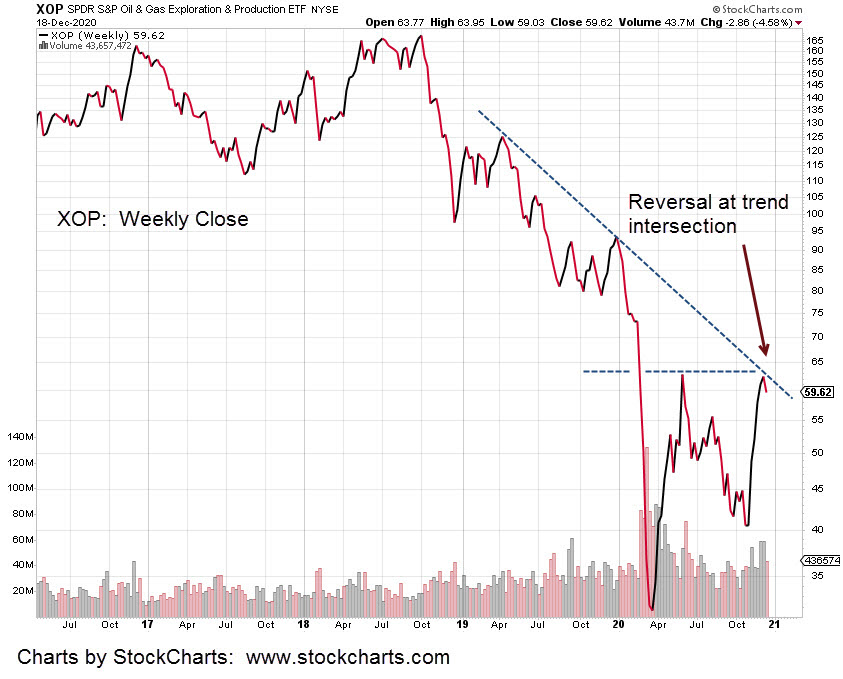
Now, we see confirmation of the confluence.
XOP reversed right at trend intersection.
Doing so, validates those resistance areas.
If the XOP reversal continues, next step is maintain short while determining the market’s own time frame for decline.
That means going through charts of XOP, selecting Daily, 2-Day, 3-Day charts and so on, until the best price action correlation to time, is observed.
The last major down-leg in XOP, lasting from January 8th to March 19th was best represented using a 7-Day chart.
Setting stops on the way down (DUG up) using the 7-Day, would have allowed the majority of the move to be captured.
Low-to-high on DUG from January 8th to March 19th, was 37.48 – 184.95; a gain over 393%.
Stay Tuned
Charts by StockCharts
