Enormous Downside Potential

Looking at Real Estate Index IYR, below, is all anyone needs to know.
It’s a set-up for a massive decline (not advice, not a recommendation).
For months, if not years, everyone’s been looking for ‘The Crash’.
Well, it looks like we’re on the cusp of some type of event.
Real Estate, IYR Weekly Close
The chart puts it into perspective.
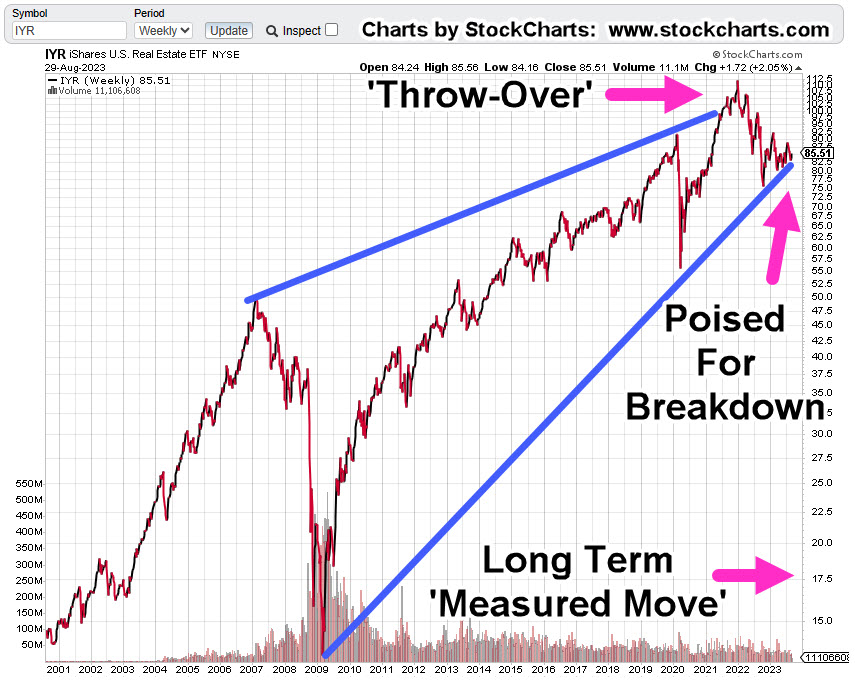
We have a weekly close chart going all the way back to mid-2000, and it shows a massive ‘terminating wedge.’
Tomorrow’s data release is ‘pending home sales’.
On a daily chart to be provided in the next update, IYR price action has come back (up) to test resistance.
If there’s a downside reversal IYR’s likely to head back down to the multi-year trendline … again.
Stay Tuned
Charts by StockCharts
Note: Posts on this site are for education purposes only. They provide one firm’s insight on the markets. Not investment advice. See additional disclaimer here.
The Danger Point®, trade mark: No. 6,505,279

Pingback: Real Estate … The Breakdown « The Danger Point®
Pingback: Santa Clause Rally? « The Danger Point®
Pingback: Real Estate’s Massive Channel « The Danger Point®