What Does It Mean?

So, what does the chart breakdown mean?
‘Buckle your seatbelt Dorothy, ’cause Kansas is going bye-bye’
Right along with the airlines, packaging and containers (like BALL), are down hard from their all-time highs, posted long ago.
As of Friday’s close, BALL is down a stiff – 57%, from its 2020 highs and we could be just getting started.
Do Not Pass ‘Go’
It’s the opinion of this author, we never had or are going to have, a ‘recession’.
We went straight past that, right into ‘depression.’
The monthly chart below, has a massive Head & Shoulders pattern that’s been years in the making.
Ball Corp. (BALL), Monthly
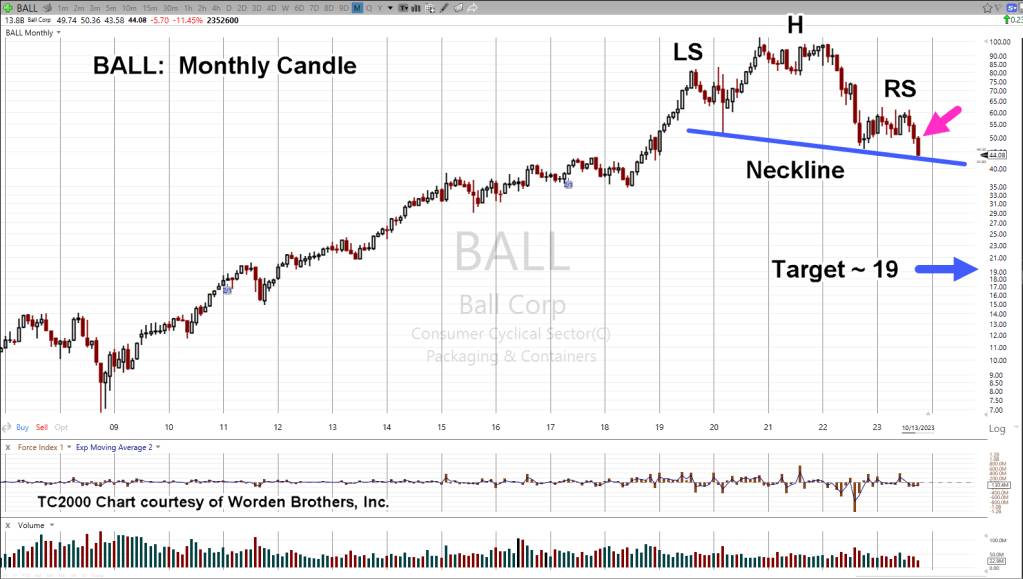
From a textbook standpoint, this is near perfection.
An obvious Left Shoulder, Head, and Right Shoulder.
The Neckline is sloping downward, indicating weakness.
The retrace from the October 2022 lows (not shown), has managed only Fibonacci 23.6%, providing confirmation of significant weakness.
The magenta arrow shows it’s been three months in-a-row (the ‘breakdown’) of lower action.
Penetration & Support
BALL, has penetrated prior lows posted during October 2022, and we’re currently at the neckline.
That means Wyckoff ‘spring’ position (penetrating the lows) and there’s a potential for some type of upward action; not much, but the possibility is there.
Positioning
BALL may present the opportunity for a direct short (borrowing, selling the actual stock), with good daily volume and dividend of only 1.8% (not advice, not a recommendation).
Note: A direct short puts the trader on the hook for paying the dividend and any other upward short covering ‘surprises’ … risky indeed.
Stay Tuned
Charts by StockCharts
Note: Posts on this site are for education purposes only. They provide one firm’s insight on the markets. Not investment advice. See additional disclaimer here.
The Danger Point®, trade mark: No. 6,505,279
