Commodity ‘Blow-Off’
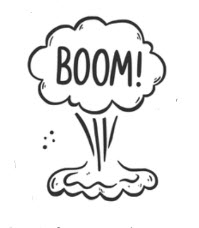
Throughout market history, commodity tops usually end the same way … Boom!
This time around for copper, it appears to be no different.
If we go to the futures chart (link here), it’s self-explanatory.
From the link, select ‘MAX’ on the chart and we see, copper’s pulling back from all-time highs.
As always, it could somehow recover right along with silver (update due later).
However, using proxy Freeport-McMoRan Inc., (FCX), it has already printed an outside down weekly bar after posting a decade-long, new high:
That translates to ‘not good’ for the bulls (not advice, not a recommendation)
Freeport McMoRan, FCX, Weekly & Daily
Price action appears to be reversing or at least testing the resistance (blue) line; attempting to see if that line has now become support.

Moving in closer, we see the outside down weekly bar that has entered ‘back into the range’; just touching the Resistance/Support area.

If we get even closer and look at the daily, price action’s back in the trading range (bearish) and has also posted a divergent MACD (bearish).

Looking at the charts, we’re at The Danger Point®
This is the place where the market makes its decision (not advice, not a recommendation).
Inflation, Deflation, Stagflation … or … ‘X-Flation’
It’s interesting, but then again not, watching so-called experts pretend they have it figured out:
It’s inflation or stagflation or whatever.
How about the possibility of ‘non-of-the-above’?
The past four years have put us into a new construct, a new paradigm.
Before the 1970s, nobody even knew that ‘stagflation’ existed. It had never happened before.
So, what new construct is going to emerge (and be given a name) that has never happened before?
That’s the question.
Stay Tuned
Charts by StockCharts
Note: Posts on this site are for education purposes only. They provide one firm’s insight on the markets. Not investment advice. See additional disclaimer here.
The Danger Point®, trade mark: No. 6,505,279
