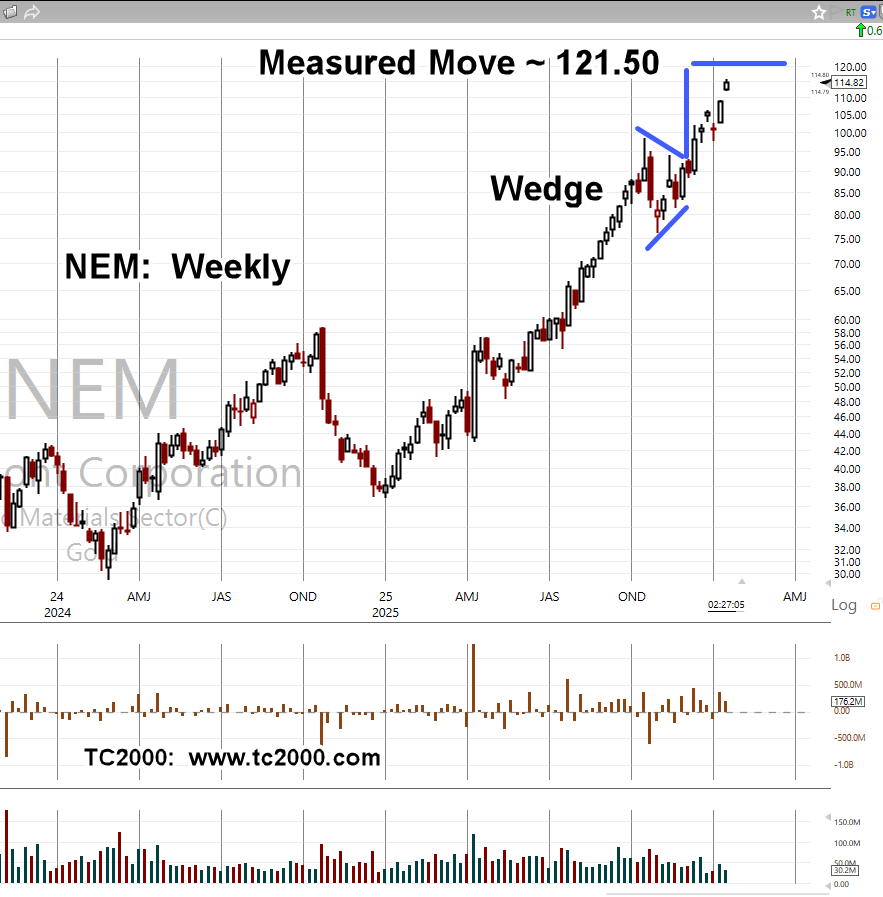
The last update on silver SLV, presented a (potential) measured move target, link here.
At the end of that post, was this:
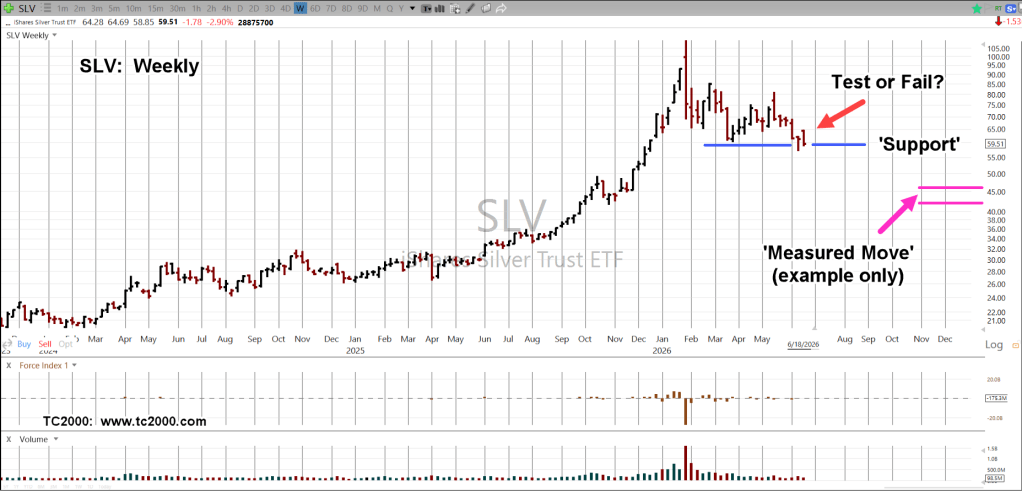
“However, we’re near support levels; penetrating those would technically put SLV in Wyckoff ‘spring’ position.
That would imply some upside testing before continuing lower.”
So, here we are.
SLV penetrated support, then moved higher in a ‘spring’ attempt, and is now back to test support levels.
Silver SLV, Weekly
If price action manages to bounce higher from here, moving past the weekly high (64.69), then momentum has shifted to the upside (not advice, not a recommendation).
Note: Posts on this site are for education purposes only. They provide one firm’s insight on the markets. Not investment advice. See additional disclaimer here.
The last update on Silver (SLV) was back in April, link here.
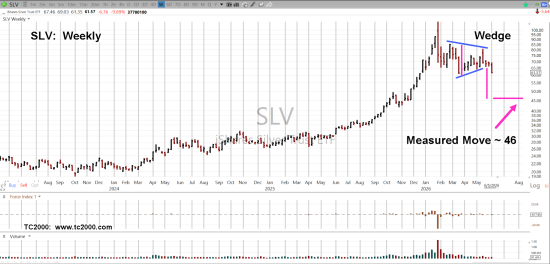
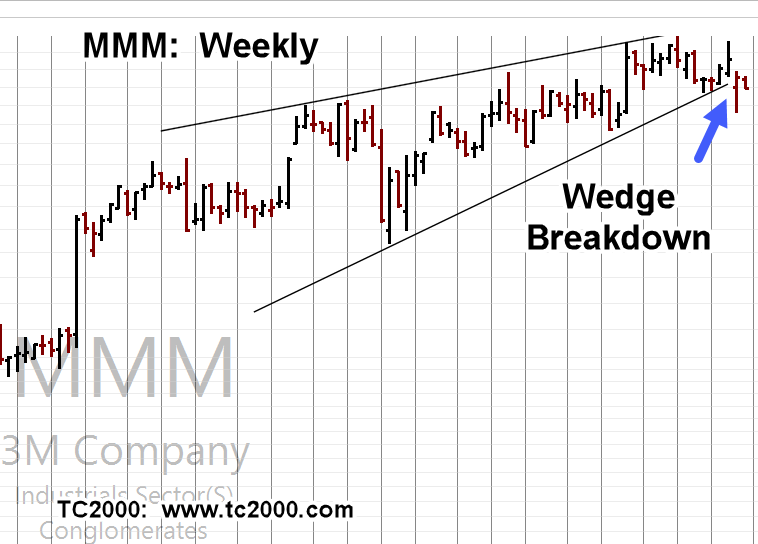
This past week’s action had SLV, breaking down from a wedge, targeting a measured move (not advice, not a recommendation).
The April link above, contained the prior ’08 meltdown scenario as an example, targeting a 60% decline; 43 – 44 area (not advice, not a recommendation).
Now, the wedge formation, targets ~46 (not advice, not a recommendation).
Silver ETF SLV, Weekly
We can see the breakout to the downside.
However, we’re near support levels; penetrating those would technically put SLV in Wyckoff ‘spring’ position.
That would imply some upside testing before continuing lower (not advice not a recommendation).
Note: Posts on this site are for education purposes only. They provide one firm’s insight on the markets. Not investment advice. See additional disclaimer here.
Yesterday’s update presented a scenario, suggesting lower prices for silver are more probable (medium term) than higher.
Another method to use for what might be next, linked here.
Important to note, the above link makes the assumption we’re in a ‘breakout’ scenario; different from ‘we’re still in a meltdown’ scenario (not advice, not a recommendation).
However, the following comment from that post sums up the situation fairly well as do the replies:
‘So difficult because in addition to historical patterns, we’re in unprecedented times.’
All the more reason to stay focused on price action; not the news, experts or pundits.
Note: Posts on this site are for education purposes only. They provide one firm’s insight on the markets. Not investment advice. See additional disclaimer here.
Note: Posts on this site are for education purposes only. They provide one firm’s insight on the markets. Not investment advice. See additional disclaimer here.
Note: Posts on this site are for education purposes only. They provide one firm’s insight on the markets. Not investment advice. See additional disclaimer here.
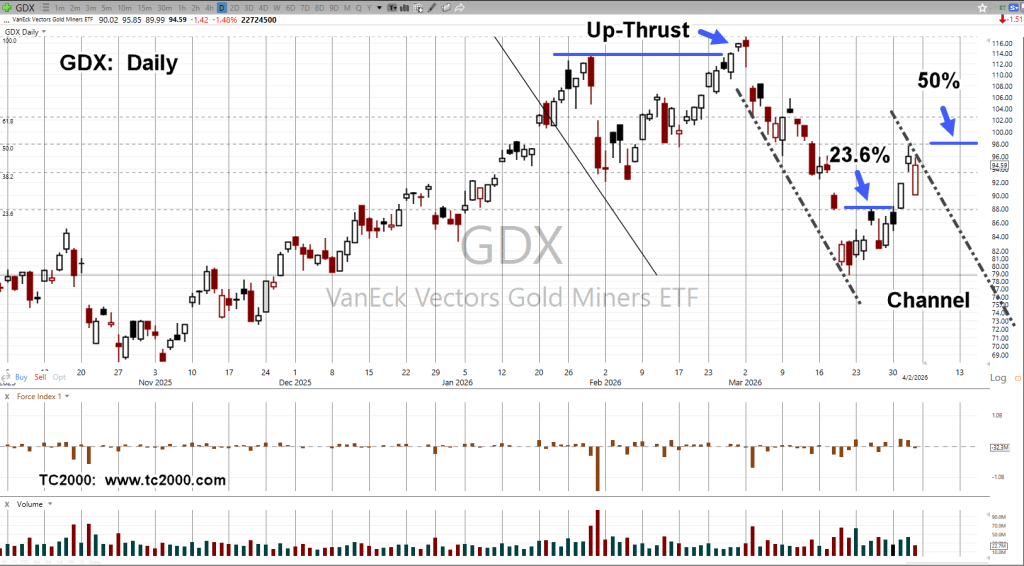
This past Wednesday, Senior Gold Miners GDX, retraced to 50%.
Thursday, price action tested that level and closed lower.
On the chart below, we’re going to present price action facts; leaving out ‘hyperinflation’, YouTube grifting, ‘dollar destruction’, ‘it’s all ending tomorrow’, click-bait.
Before getting to the chart, let’s add, on this site, it’s always been about the food supply first, then gold and silver, link here (not advice, not a recommendation).
The video at left, is five years old.
Since then, there’s been a massive learning curve concerning livestock.
All but one of those hens is gone now, she being retired, having produced 850 – 900 eggs.
Others have been brought in to continue the supply.
Now, on to the click-bait 🙂
Senior Miners GDX, Daily
GDX, posted an up-thrust, March 2nd, then collapsed a whopping -32.8%; read that, as ‘coincidental’ 33%.
It’s now retraced to 50%, and also in a potential channel.
Volume for yesterday contracted on the test, but it was also a pre-holiday trading day.
So, let’s just note that and not put undue weight on the fact, commitment to the upside was weak (not advice, not a recommendation).
Note: Posts on this site are for education purposes only. They provide one firm’s insight on the markets. Not investment advice. See additional disclaimer here.
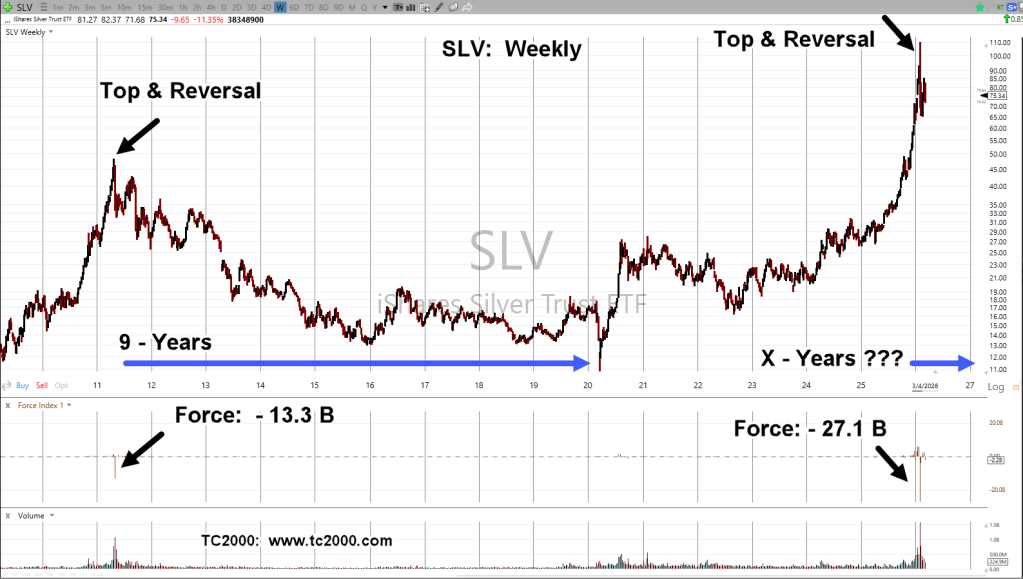
Putting aside the YouTube ‘silver to the moon’ hype, ‘dollar destruction’, and ‘economic collapse’ narratives, along with every other form of hysteria or mania du jour, we’re going to try something novel; like just looking at the chart of silver (SLV), itself.
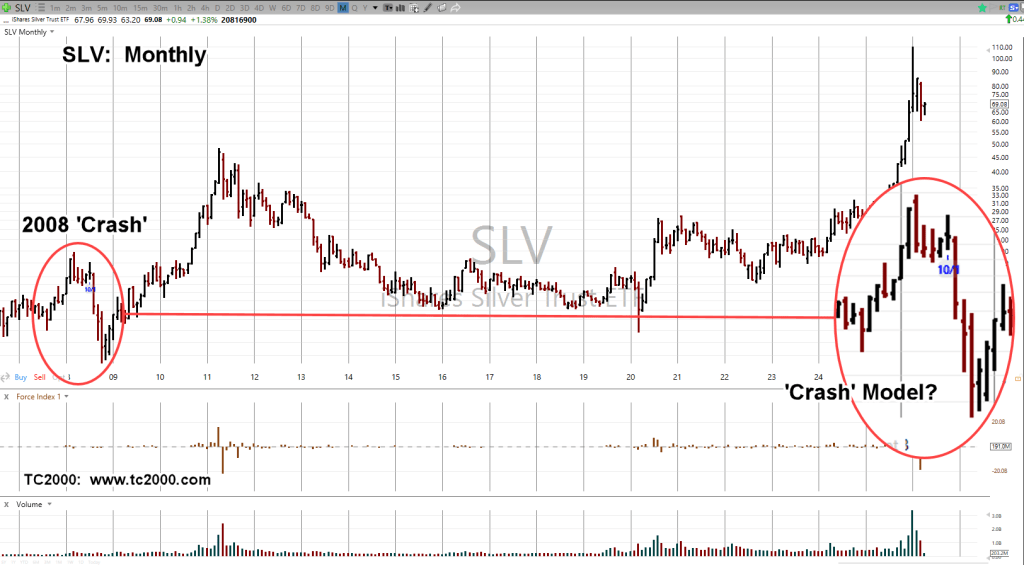
Silver Tracking ETF, SLV: Weekly
There it is.
The last top and reversal, kicked off a bear market lasting about nine-years.
This time around, downward thrust pressure (Force Index) is more than double that of the previous reversal (not advice, not a recommendation).
It’s interesting, we don’t hear any more stories about silver bullion being flown to the LME.
That’s because the last such flight was (reportedly) way back in October, link here.
Note: Posts on this site are for education purposes only. They provide one firm’s insight on the markets. Not investment advice. See additional disclaimer here.
Note: Posts on this site are for education purposes only. They provide one firm’s insight on the markets. Not investment advice. See additional disclaimer here.
Note: Posts on this site are for education purposes only. They provide one firm’s insight on the markets. Not investment advice. See additional disclaimer here.
Note: Posts on this site are for education purposes only. They provide one firm’s insight on the markets. Not investment advice. See additional disclaimer here.