Where to, From Here?

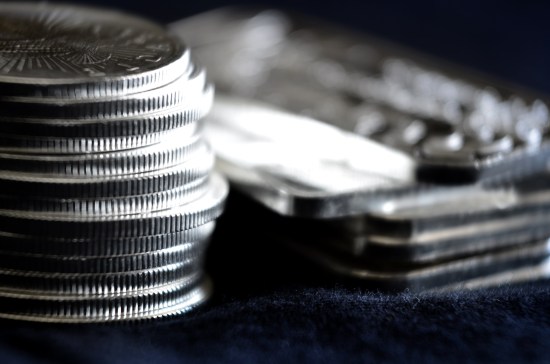
The days of breathless news stories about flying silver bars to the London Metal Exchange, are long gone.
Seems like years ago, when it’s only been nine-months.
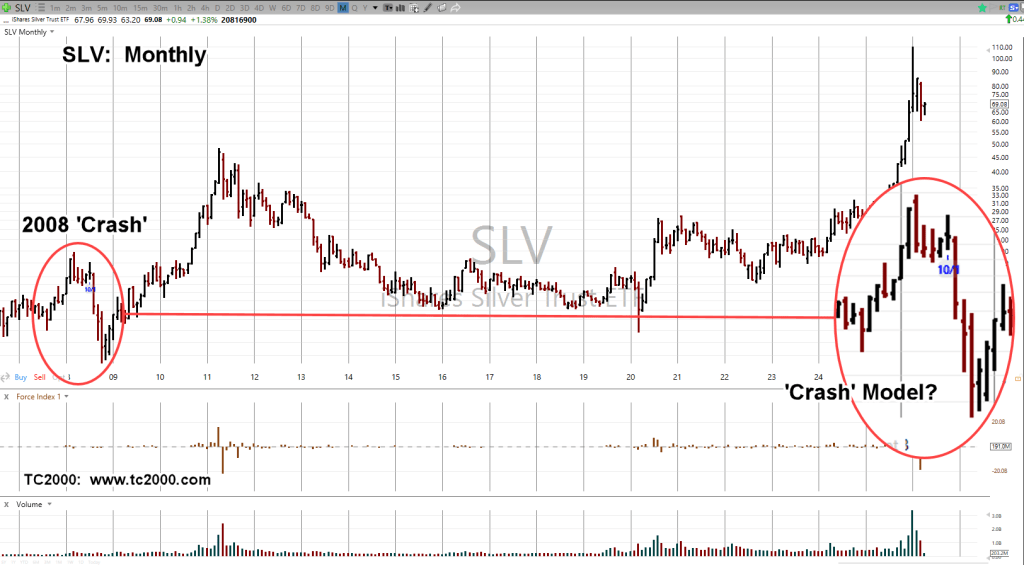
Of course, we’re still being barraged with forecasts of $500/oz. silver or ‘Can’t go below $50/oz.’; two opposing ends, both of which, are happening as we speak. 🙂
With that, let’s leave the drama behind and look at what the market’s actually saying about itself.
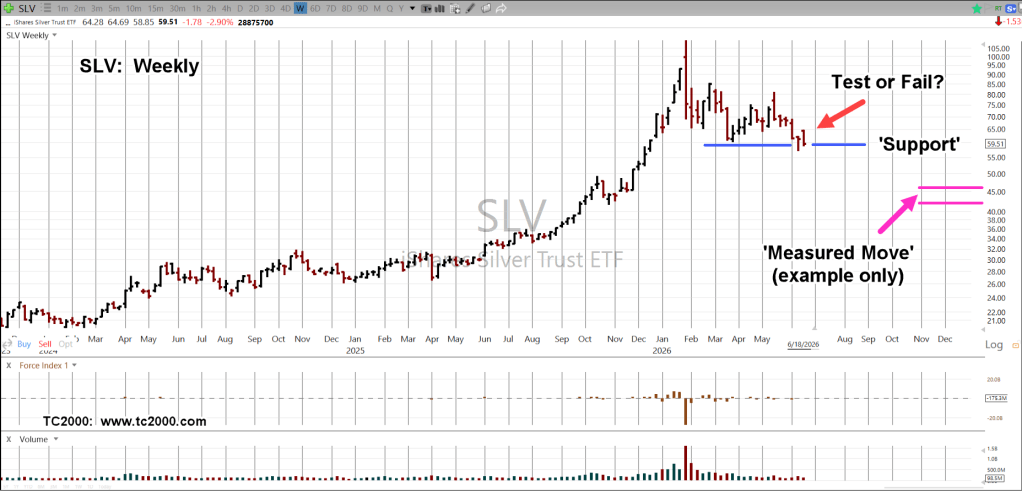
Silver SLV, Daily Close
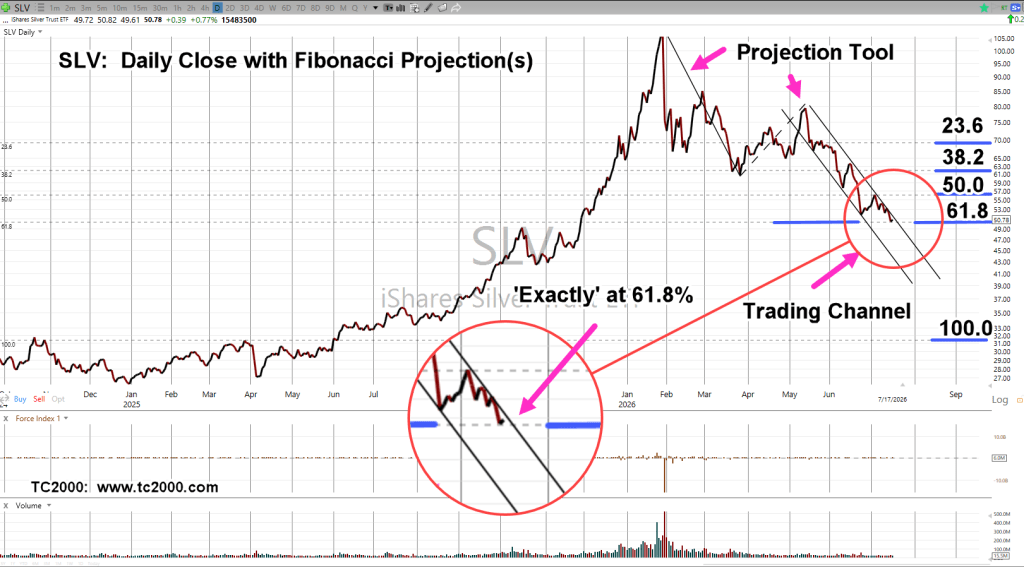
There it is.
We’re exactly at a Fibonacci 61.8% projection from the all-time highs.
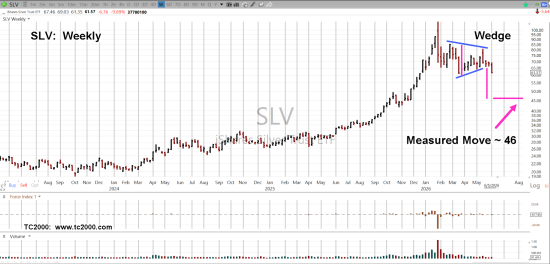
Price action’s been in a trading channel for months. Now, momentum appears to have slowed (not advice, not a recommendation).
Stay Tuned
Charts by StockCharts
Note: Posts on this site are for education purposes only. They provide one firm’s insight on the markets. Not investment advice. See additional disclaimer here.
The Danger Point®, trade mark: No. 6,505,279