‘Shorting-Out’, at The Top?

It’s likely we’ll know on Monday, whether or not last Friday’s action was a test (and completion) of the up-thrust reversal shown in the chart.
That reversal and potential test, coincides with ‘good news’, ‘bad news’, link here.
Tesla TSLA, Daily Close
Five years of price action.
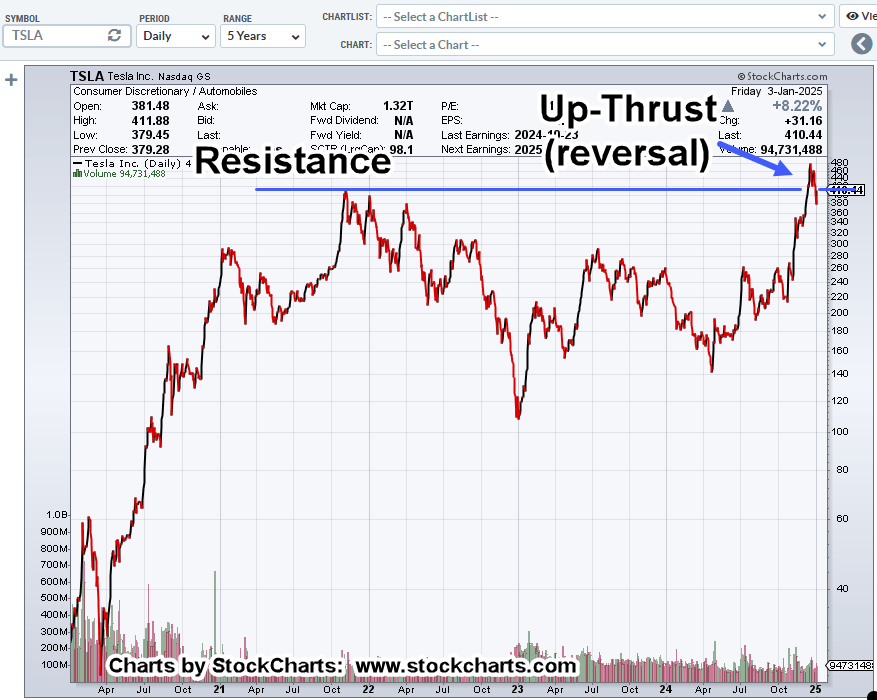
Moving in closer to nine months of action.

The ‘resistance’ level goes all the way back to November 4th, 2021, with an all-time high close of 409.97.
Note: Friday’s close of 410.44, was only +0.11%, above the prior (closing) all-time high.
Another Carvana?
Similar to Carvana and its relation to CarMax, i.e., bloated market cap, Tesla has the largest market cap of all (major) auto manufacturers, link here.
Going back to this post on Carvana, volatility reaches a minimum; CVNA, is down a stiff -27.4%, since then.
Are we about to see similar action for Tesla?
Stay Tuned
Charts by StockCharts
Note: Posts on this site are for education purposes only. They provide one firm’s insight on the markets. Not investment advice. See additional disclaimer here.
The Danger Point®, trade mark: No. 6,505,279
