Breakout From Wedge
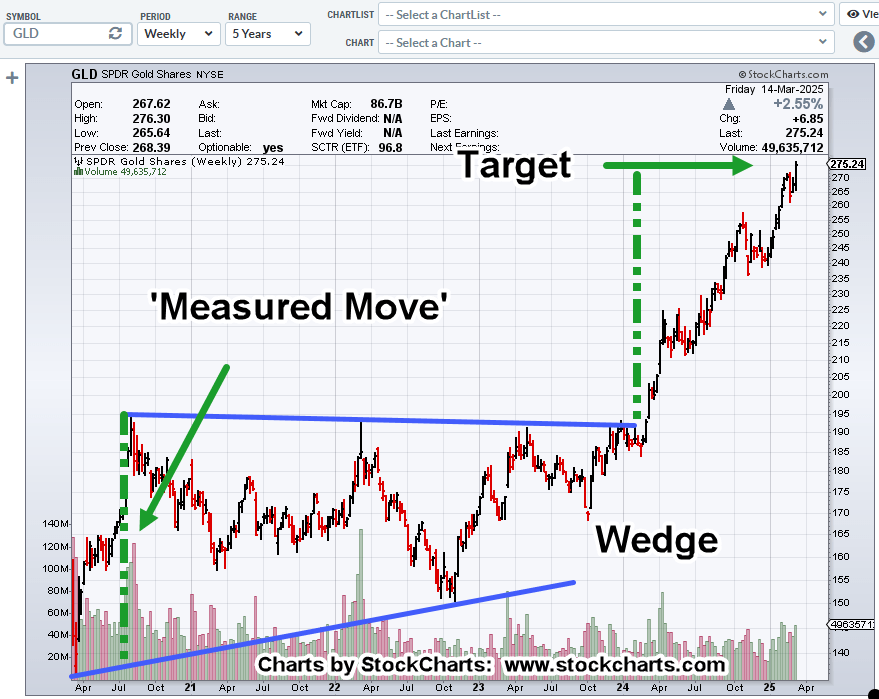
The weekly chart of gold (GLD) shows it has met a wedge breakout target.
The bottom end of the wedge is taken from the march 2020, panic lows, upward to the Sep – Nov 2022, lows.
What’s not shown, taking that trendline farther back in time, also intersects a congestion area from June – August 2019, thus providing additional validity.
Meeting a target does not mean reversal.
However, it does mean, speculators that were positioned long are likely taking profits or cashing out entirely; all the while, the media is ‘raising targets’ on its gold forecasts (not advice, not a recommendation).
Stay Tuned
Charts by StockCharts
Note: Posts on this site are for education purposes only. They provide one firm’s insight on the markets. Not investment advice. See additional disclaimer here.
The Danger Point®, trade mark: No. 6,505,279
