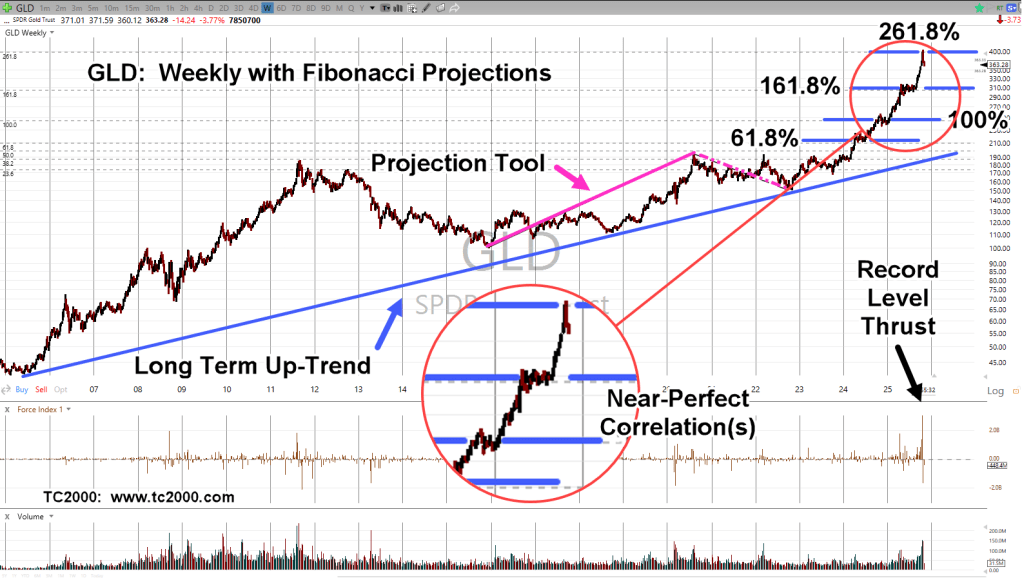
Inching Higher … Almost There

The ‘Commercials’ have left the party.
During this recent interview, long-time trader Larry Williams, says the ‘Commercials’, i.e., those who know their business, have left the party (time stamp: 17:30).
The chart itself, showed record breaking thrust higher followed by a swift down-move.
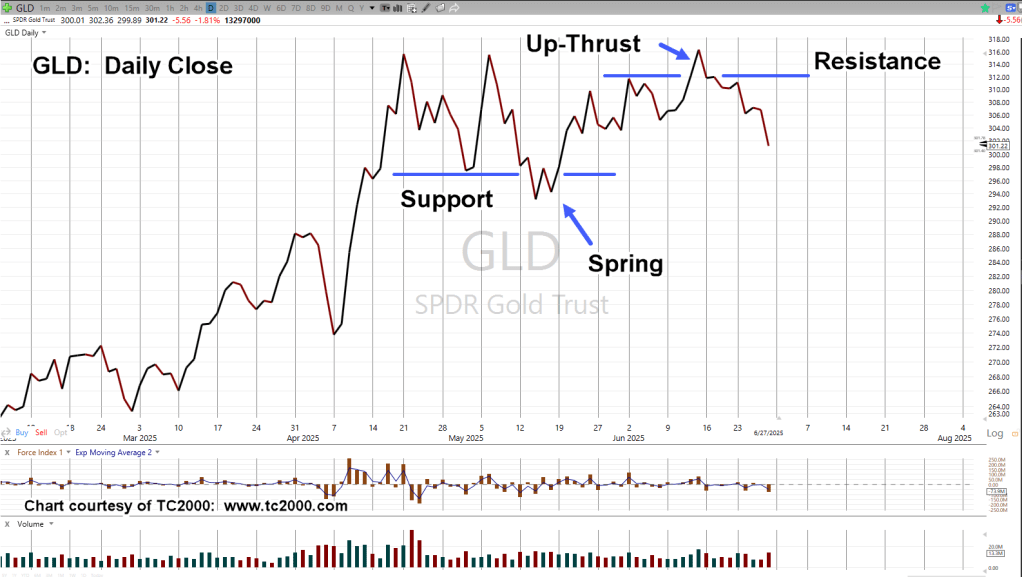
This week started with GLD, posting a gap lower.
At this point, it’s (still) trying its best to close that gap.
Gold GLD, Weekly
The Fibonacci levels remain on the chart.
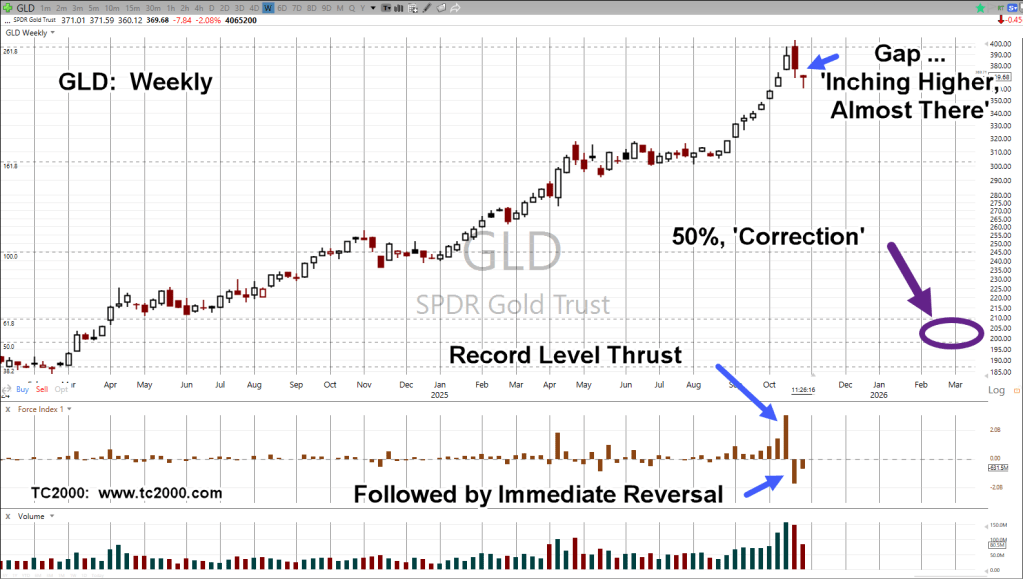
Note the 50%, ‘correction’ level, from the last update.
If last week’s high really was a significant reversal, it’s a long way down to 50%.
The fact GLD is struggling to close the gap, provides some confirmation the miners are in the same boat; possibly worse (not advice, not a recommendation).
Stay Tuned
Charts by StockCharts
Note: Posts on this site are for education purposes only. They provide one firm’s insight on the markets. Not investment advice. See additional disclaimer here.
The Danger Point®, trade mark: No. 6,505,279