An Objective Look

Putting aside the YouTube ‘silver to the moon’ hype, ‘dollar destruction’, and ‘economic collapse’ narratives, along with every other form of hysteria or mania du jour, we’re going to try something novel; like just looking at the chart of silver (SLV), itself.
Silver Tracking ETF, SLV: Weekly
There it is.
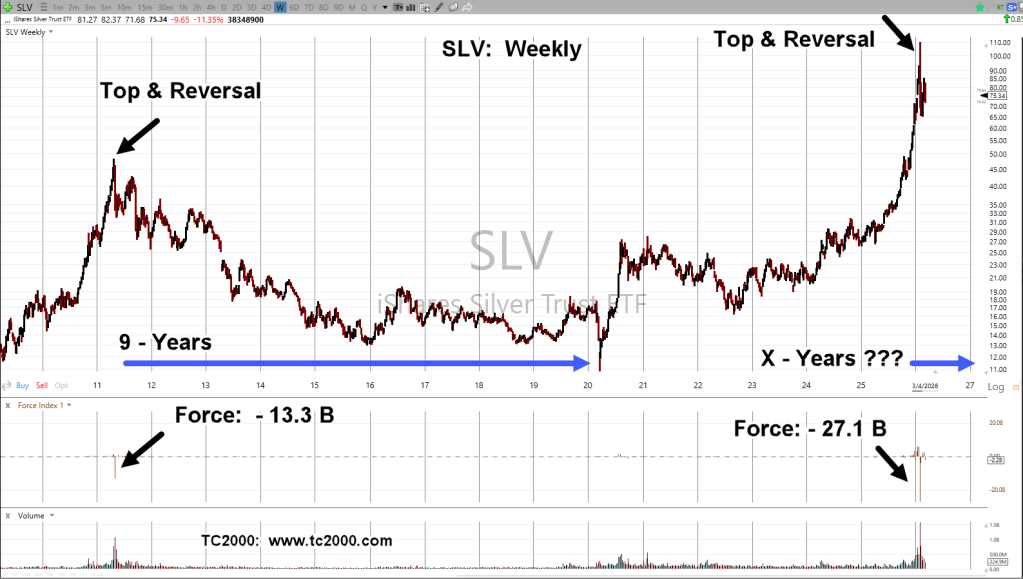
The last top and reversal, kicked off a bear market lasting about nine-years.
This time around, downward thrust pressure (Force Index) is more than double that of the previous reversal (not advice, not a recommendation).
It’s interesting, we don’t hear any more stories about silver bullion being flown to the LME.
That’s because the last such flight was (reportedly) way back in October, link here.
Stay Tuned
Charts by StockCharts
Note: Posts on this site are for education purposes only. They provide one firm’s insight on the markets. Not investment advice. See additional disclaimer here.
The Danger Point®, trade mark: No. 6,505,279
