Fuel Price Hit

Walmart slammed lower on earnings.
From a price action standpoint, it sets up several interesting dynamics.
As we’ll see below, the long-term monthly view, shows a bearish MACD divergence (not advice, not a recommendation).
On that same chart, there’s (so far) an outside-down bar, otherwise known as a ‘key reversal’.
Daily action to be covered in a subsequent update.
Walmart WMT, Monthly
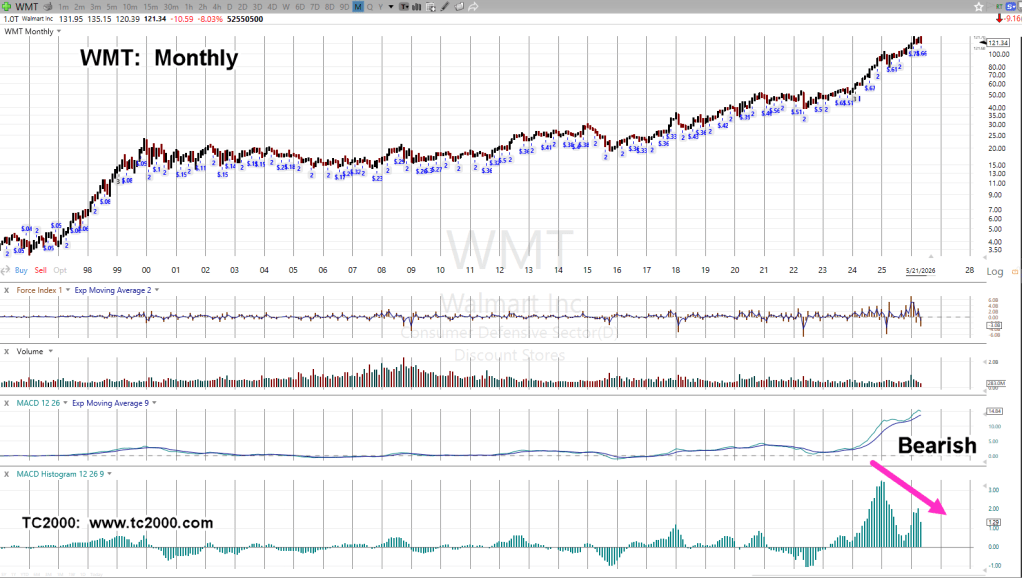
Going all the way back to 1995, the long-term view shows indicators like MACD, have literally gone ‘off the chart’.
Look at the size of the MACD divergence when compared to the past 30-years!
Meanwhile, as Ox Talks tells us, the crowd seems to be partying like it’s 1999.
Stay Tuned
Charts by StockCharts
Note: Posts on this site are for education purposes only. They provide one firm’s insight on the markets. Not investment advice. See additional disclaimer here.
The Danger Point®, trade mark: No. 6,505,279
