Final Move?
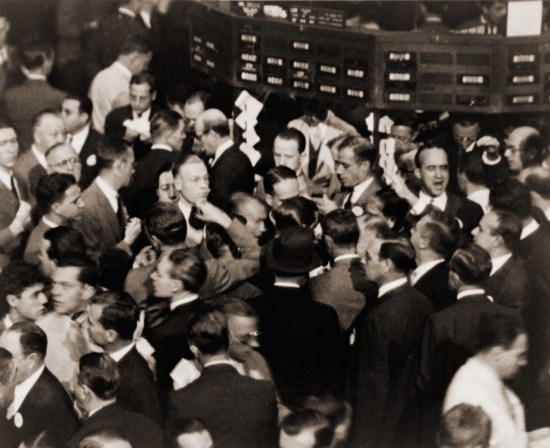
If the Nasdaq, QQQ manages to breakout higher from its wedge pattern, the rally may last into August; the top of the market in 1987 (not advice, not a recommendation).
Such a rally would need to start soon, if the pattern is in-effect.
Otherwise, we may see it morph into something else or fail, with a decline from here.
Nasdaq QQQ, Daily
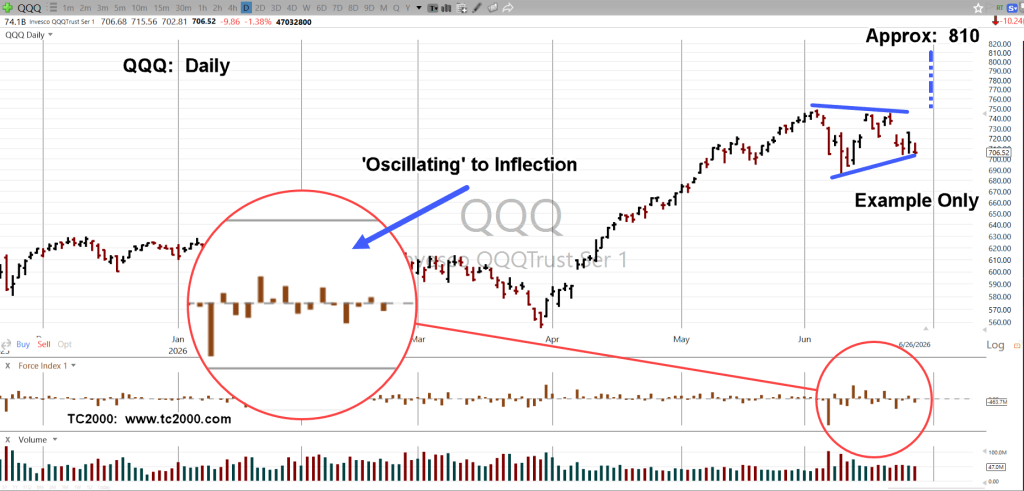
Note how Force Index (zoom area) has oscillated itself into an inflection point.
Stay Tuned
Charts by StockCharts
Note: Posts on this site are for education purposes only. They provide one firm’s insight on the markets. Not investment advice. See additional disclaimer here.
The Danger Point®, trade mark: No. 6,505,279


I thought the charts in this Ciovacco video were interesting. It basically illustrates the topping pattern that occured in 1999-2000. If something similar happened again, it would give short-sellers ample time to build short positions.
LikeLiked by 1 person
Thank you for the link.
I watched the video. In the 2000 case, the S&P held up better than the Nasdaq QQQs. They had a crash first, then went sideways like the S&P before rolling over into a sustained decline.
It’s true, there was time to ‘build positions’.
However, living through it in real time (for months) you started to wonder if the initial crash ever really happened. The sideways action took so long that it was hard to tell if the down move was over.
Then came the trend break and the sustained multi-year drawdown.
Thanks again for your input. It’s appreciated.
Regards,
Paul
LikeLiked by 1 person