Note: Posts on this site are for education purposes only. They provide one firm’s insight on the markets. Not investment advice. See additional disclaimer here.
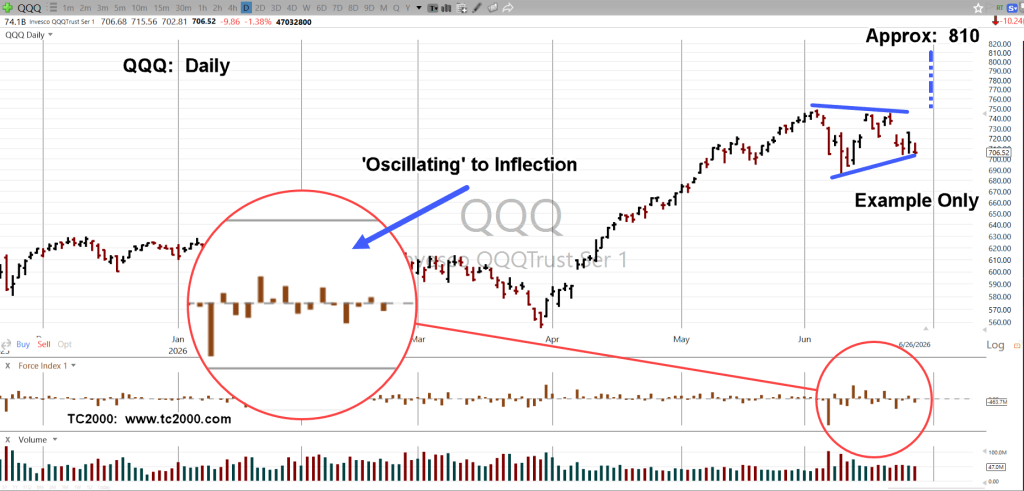
If the Nasdaq, QQQ manages to breakout higher from its wedge pattern, the rally may last into August; the top of the market in 1987 (not advice, not a recommendation).
Such a rally would need to start soon, if the pattern is in-effect.
Otherwise, we may see it morph into something else or fail, with a decline from here.
Nasdaq QQQ, Daily
Note how Force Index (zoom area) has oscillated itself into an inflection point.
Note: Posts on this site are for education purposes only. They provide one firm’s insight on the markets. Not investment advice. See additional disclaimer here.
Note: Posts on this site are for education purposes only. They provide one firm’s insight on the markets. Not investment advice. See additional disclaimer here.
Note: Posts on this site are for education purposes only. They provide one firm’s insight on the markets. Not investment advice. See additional disclaimer here.
If there’s any one interview that details what’s really going on, it’s this, link here.
The 48-mintue Kitco session with Bert Dohmen, is much needed straight talk.
It’s all there:
Official data is fake. Markets will (likely) ‘trap’ bulls with massive gap-down. It’s 1929 (again). Crypto is an illusion. Silver/Gold will correct (temporarily) along with the markets. We’re surrounded by bought off media. The population (masses) don’t think or can’t think.
Adding to that are ideas and sources discussed for years on this site, like ShadowStats having ‘real’ data on unemployment and inflation.
The list goes on.
With all that said, let’s look at one of the sectors (retail brokers), that could be hit hard during a surprise downturn.
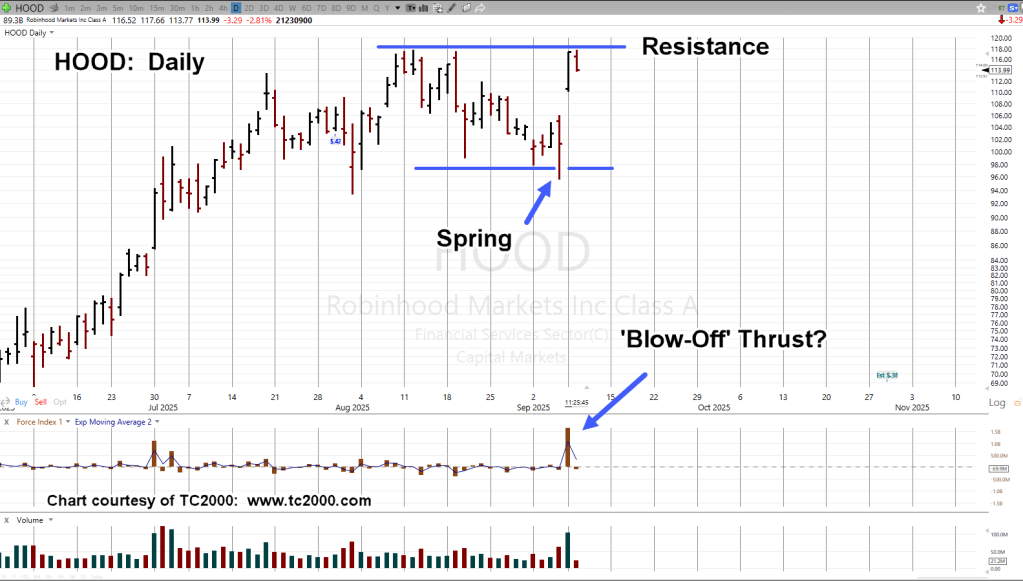
Robinhood HOOD, Daily
It’s important to note, price action late Friday, began to pull away from the lows … rising into the close.
Just after that close, the announcement, HOOD made it to the S&P.
Wyckoff said a century ago:
‘Somebody always knows something. That ‘something’ shows up on the tape’
Well, there it is.
Was yesterday (the start of) a blow-off?
Froce Index (thrust) was the largest since the IPO, trading on August 4th, of 2021.
Price action is currently (as of 11:58 a.m., EST) retreating off the highs.
Note: Posts on this site are for education purposes only. They provide one firm’s insight on the markets. Not investment advice. See additional disclaimer here.
So, here we are nearly on the eve of the most significant reversal, ever:
September 3rd, 1929
That is, maybe, until now.
Today’s downside action may turn out to be just a blip; much ado about nothing.
Or it could be the harbinger of a top. Maybe the top (not advice, not a recommendation).
Biotech sector XBI, appears to be losing steam while at the same time, being in up-thrust (potential false breakout) condition.
As of this post (12:10 p.m., EST), XBI is down -0.63%, and has posted a new daily low. Short position XBI-25-03, remains active (not advice, not a recommendation).
We’ll discuss this index and others over the long weekend.
Note: Posts on this site are for education purposes only. They provide one firm’s insight on the markets. Not investment advice. See additional disclaimer here.
Note: Posts on this site are for education purposes only. They provide one firm’s insight on the markets. Not investment advice. See additional disclaimer here.
Note: Posts on this site are for education purposes only. They provide one firm’s insight on the markets. Not investment advice. See additional disclaimer here.
Market reversals tend to occur just before, during, or just after a holiday week.
Is that where we are now?
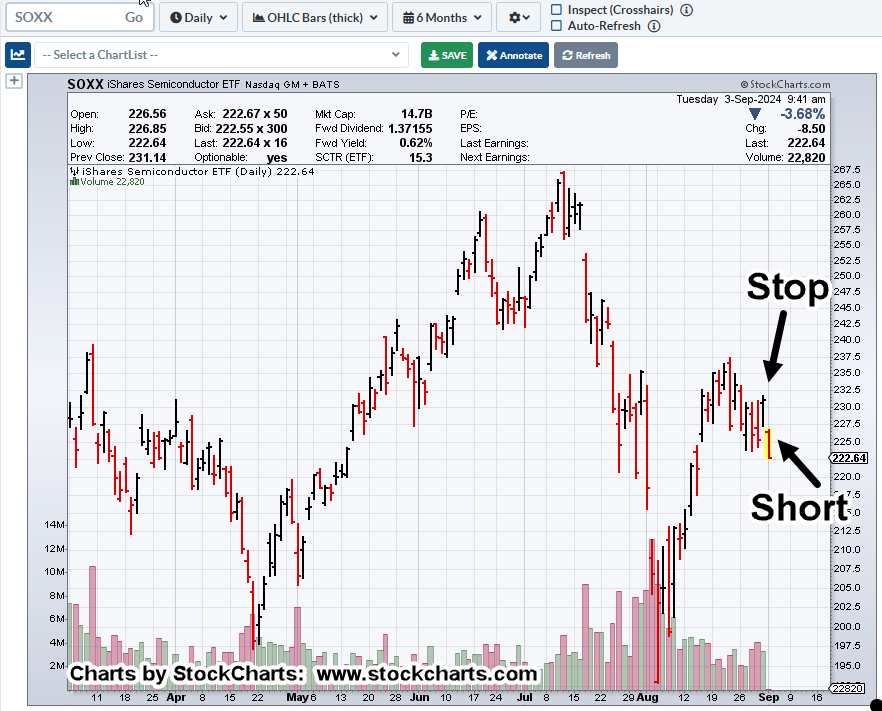
Semiconductors (SOXX), and it’s chief cook and bottle washer, Artificial Intelligence (NVDA), may have already decided the next direction … down.
Semiconductors, SOXX, Daily
It’s just after the open and this is where we are.
“What do you see?”
Marking up the chart, we have a sell-short indicator (not advice, not a recommendation) right along with a hard stop location (as shown).
From yesterday’s update, those that watched the presentation by Robert Prechter Jr., were challenged with the idea, we’re in the largest bubble ever or at least since the 1720s South Sea Bubble (not advice, not a recommendation).
Positioning
In the sidebar, we can already see a short position was opened during last Friday’s session: SOXS-24-15 (not advice, not a recommendation).
Everyone has their own style and for me, I detest ‘chasing’ the market.
I’d rather make several attempts, get stopped out, then enter again, than watch the opportunity take off because I was too afraid to pull the trigger.
It’s only 20-minutes after the open and we can see the SOXX, is down hard.
Note: Posts on this site are for education purposes only. They provide one firm’s insight on the markets. Not investment advice. See additional disclaimer here.
To minimize risk, you need to position at the psychological extreme.
That’s not necessarily the top or bottom of a move, but it could be.
At Opposite Ends
From a trading standpoint, this past week saw a lot of activity.
Trades entered, exited, some re-entered, some, not.
The net result was two positions in separate, non-correlated markets.
One was shorting the SOXX, via SOXS, the other, adding to longs in Natural Gas via UNG (not advice, not a recommendation).
Fake, Fraud & Thought Shaping
By far the main hysteria is in AI, and its cohort, the semiconductors, SOXX.
From my first trade way back in the spring of ’87, to now, I’ve never seen a mass psychosis mania, fueled by propaganda, lies and made-up numbers, like this.
One can only guess where or when the shoe will drop that starts the whole (mind-shaping) scheme unraveling.
Evidence Of A Struggle
When price action pushes above or below established resistance or support, it’s at The Danger Point®
When that happens, depending on the action itself, the risk of being wrong (on an opposing position) is lowest.
The SOXX may be there now.
Semiconductor SOXX, Hourly Chart
It’s clear, a battle’s going on between bulls and bears at resistance (blue line).
Just before, during, or just after a holiday week tend to be pivot points in the market.
Said many times on this site, the most famous of these was September 3rd, 1929, the Tuesday following the Labor Day Weekend.
That was the all-time high, just before the crash.
Positioning
There are two positions open, each with a tight stop (not advice, not a recommendation)
Note: Posts on this site are for education purposes only. They provide one firm’s insight on the markets. Not investment advice. See additional disclaimer here.