Linda Raschke, Master Trader

She needs no introduction but for those unfamiliar, here are some references.
Featured in the documentary Floored, her comments start at time stamp 4:34.
Other YouTube references are here and here.
Interview: Linda Raschke
Recent comments on being proficient, successful, flexible and un-biased, link here.
She speaks for a total of nine-minutes and twelve seconds; every single word is important.
Key Takeaways:
‘Ego, and calling direction, the most harmful thing a trader can do’
‘Attempting to project’
‘Waiting for the opening, does not come along that often’
‘Using weekly chart’
‘Frequency of Occurrence per market’
‘Profit centers’
‘It’s an 80-hour a week job’
‘Always looking ahead to the next trade and not thinking about trying to get back in’
‘Maintain fexibility’
‘No opinions … period, don’t box yourself into a corner’
‘Even verbalizing creates a bias’
‘Where the market shouldn’t go’
Stay Tuned
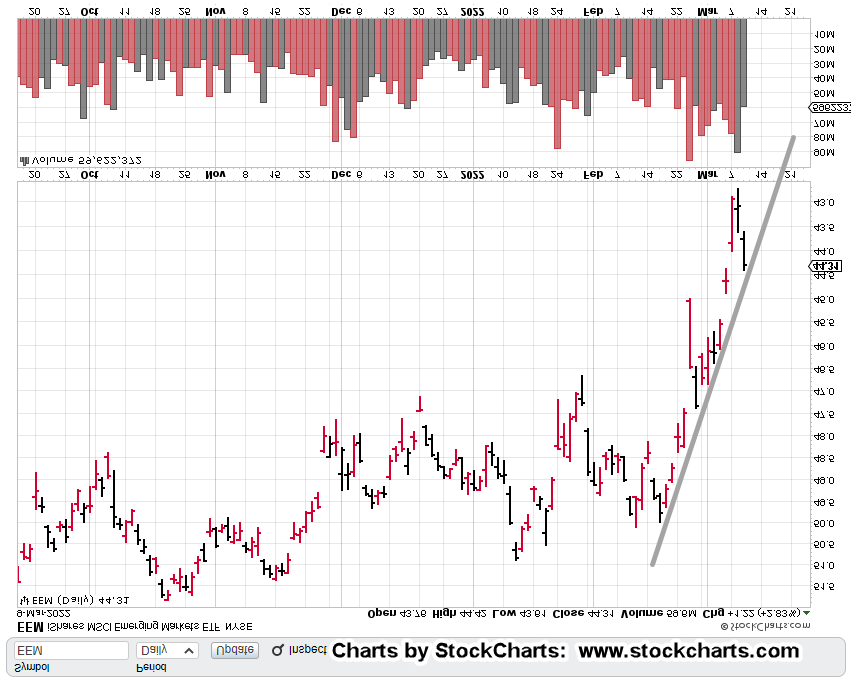
Charts by StockCharts
Note: Posts on this site are for education purposes only. They provide one firm’s insight on the markets. Not investment advice. See additional disclaimer here.
The Danger Point®, trade mark: No. 6,505,279