Note: Posts on this site are for education purposes only. They provide one firm’s insight on the markets. Not investment advice. See additional disclaimer here.
Note: Posts on this site are for education purposes only. They provide one firm’s insight on the markets. Not investment advice. See additional disclaimer here.
Note: Posts on this site are for education purposes only. They provide one firm’s insight on the markets. Not investment advice. See additional disclaimer here.
Note: Posts on this site are for education purposes only. They provide one firm’s insight on the markets. Not investment advice. See additional disclaimer here.
Note: Posts on this site are for education purposes only. They provide one firm’s insight on the markets. Not investment advice. See additional disclaimer here.
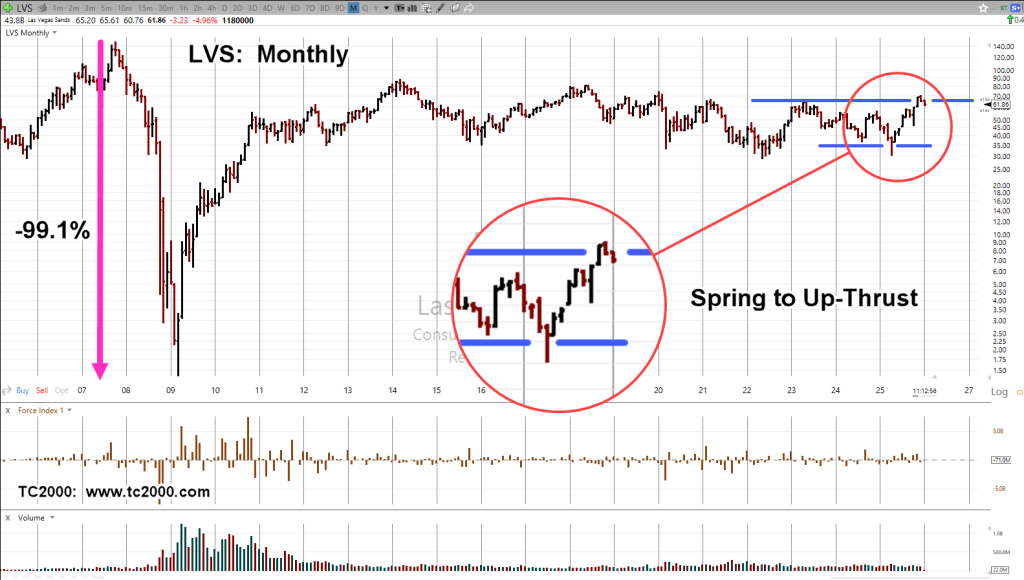
The latest out from ZeroHedge, says that Michael Burry (a.k.a., The Big Short), while claiming Tesla is overvalued (current P/E, 271), does not have a short position.
Adding to the ‘overvaluation’ theme, is deterioration in sales that’s now entering its second year; here and here. Yet, TSLA just made all-time highs this past December 22nd.
In a nutshell, this is the problem with ‘fundamentals’.
Meaning, as far as assessing price action probability, they’re not useful and never have been (not advice, not a recommendation).
A good example of that premise is CrowdStrike (CRWD); with its current P/E, at minus 428. That’s a negative.
When their P/E, is positive, which is not often, we get numbers like 786; yet, the closing price (yesterday) for CRWD was 468.76, with a market cap of 119.4 billion.
How does that even work?
Possibly more entertaining from the ZeroHedge link, are the comments. All kinds of reasons not to short Tesla.
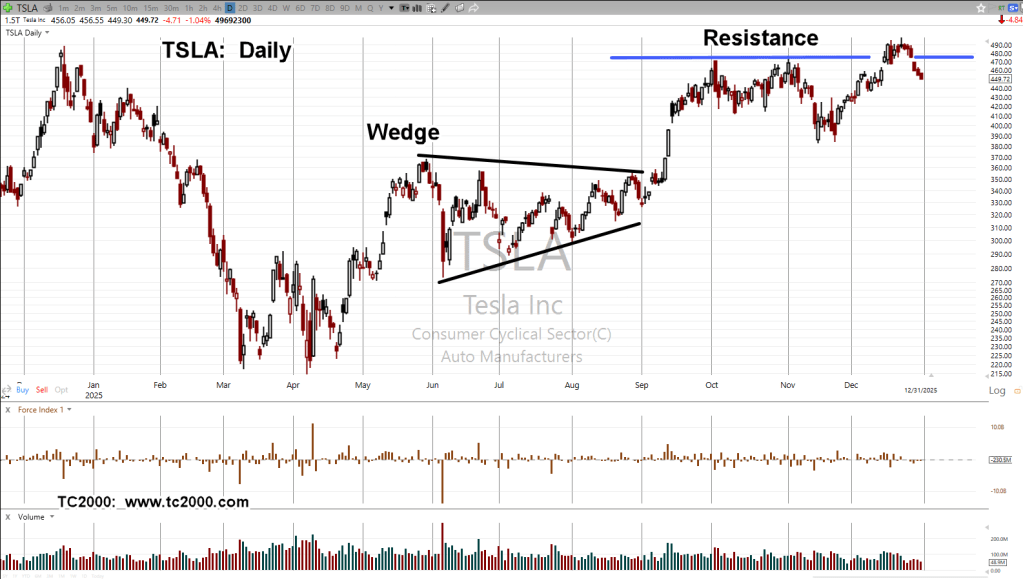
Tesla TSA, Daily
What do you see?
TSLA printed an all-time high on an attempted breakout that has so far, fallen below resistance.
On the sell side, is of course, to short TSLA directly.
Not wanting to be completely exposed to any untoward action, one can short Consumer Discretionary XLY, and effectively short AMZN as well (not advice, not a recommendation).
Note: Posts on this site are for education purposes only. They provide one firm’s insight on the markets. Not investment advice. See additional disclaimer here.
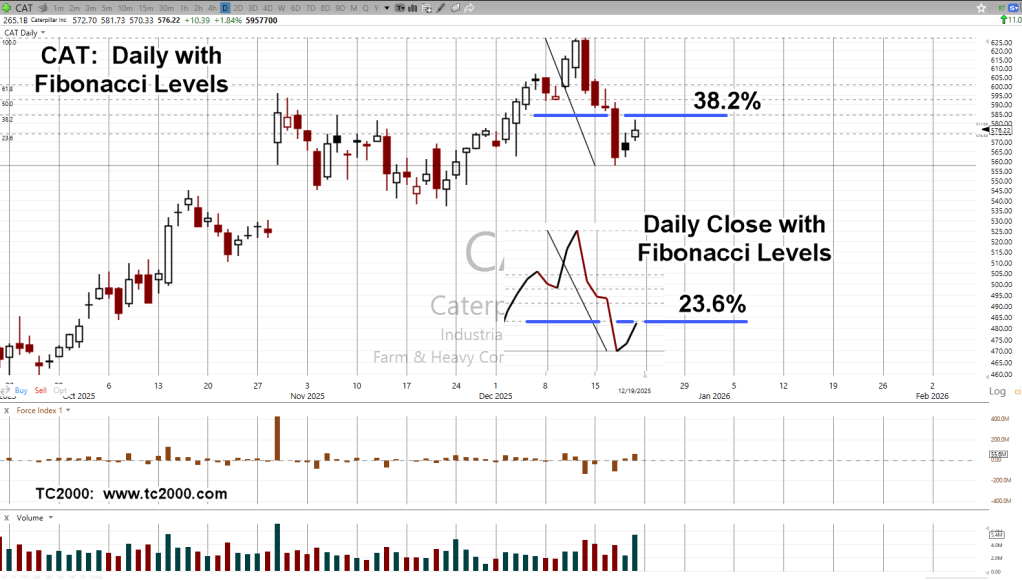
As the tagline says, we had two Fibonacci levels posted by CAT on Friday.
The chart shows a print low on the 17th, to Friday’s high, was 38.2% retrace of the move from all-time highs.
The insert shows the close version of the same chart. On a close basis, CAT retraced 23.6%.
Caterpillar CAT, Daily
Note the action of the past two trading days were ‘inside’ the down bar posted on the 17th.
With the trend break from the prior update, then posting a retrace of two Fibonacci levels simultaneously, plus the large high-volume bar (on the 17th), suggests the upside test may be complete (not advice, not a recommendation).
The week ended with multiple records set, link here.
Note: Posts on this site are for education purposes only. They provide one firm’s insight on the markets. Not investment advice. See additional disclaimer here.
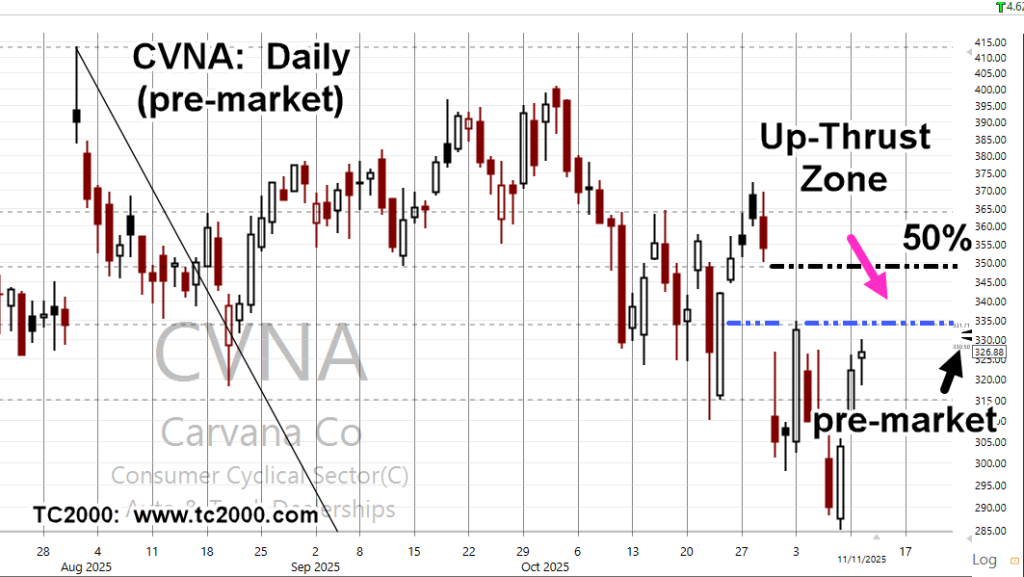
“Technically speaking and from a Wycoff standpoint, any push past and into the 38%, level (lower, blue dashed-line), puts CVNA in ‘up-thrust’ (potential reversal) position.”
For that day, CVNA retraced upward to 50%, posted the up-thrust, then reversed (not advice, not a recommendation).
Carvana CVNA, Daily
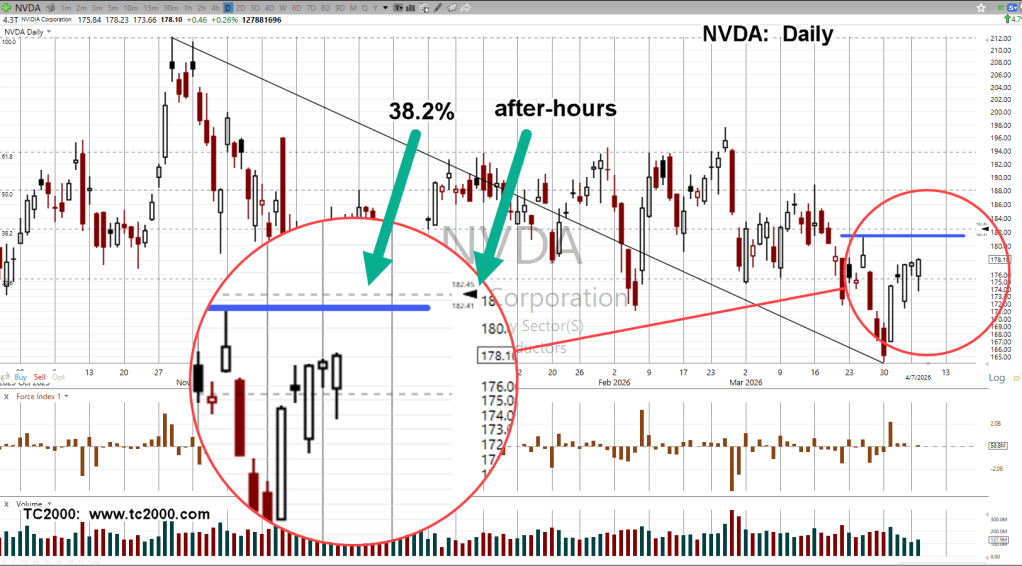
Depending on A.I., and Nvidia specifically (more upside?), there’s a chance of a close above the 332.33 level previously discussed (not advice, not a recommendation).
However, some think last week was ‘it’; the market has cracked.
Note: Posts on this site are for education purposes only. They provide one firm’s insight on the markets. Not investment advice. See additional disclaimer here.
With about 15-minutes before the regular open, CVNA has moved slightly higher from yesterday and is nearing Fibonacci retrace levels.
Technically speaking and from a Wycoff standpoint, any push past and into the 38%, level (lower, blue dashed-line), puts CVNA in ‘up-thrust’ (potential reversal) position.
The preferred scenario is a session close within the ‘Up-Thrust Zone’ (not advice, not a recommendation).
Separately, this link is one of the most recent, describing the precarious overall condition of the market.
Note: Posts on this site are for education purposes only. They provide one firm’s insight on the markets. Not investment advice. See additional disclaimer here.
Note: Posts on this site are for education purposes only. They provide one firm’s insight on the markets. Not investment advice. See additional disclaimer here.