Mid Session
PACCAR Truck Builder In Reverse
PACCAR’s in reverse in more ways than one.
From a market standpoint, this morning’s action puts PCAR at the danger point.
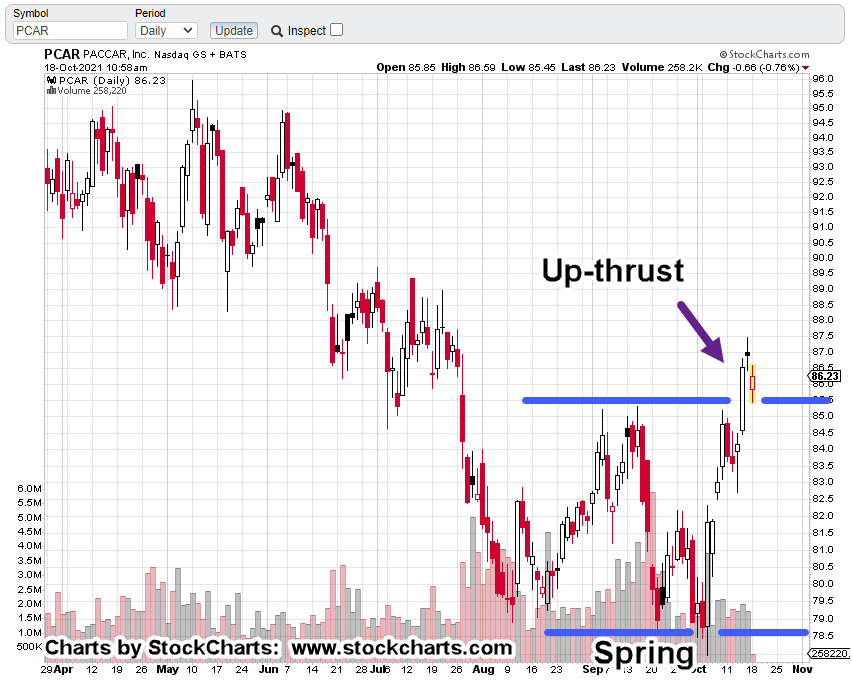
If today’s action or subsequent action can’t make a new daily high, then we’re in a potential up-thrust (reversal) condition.
The daily chart shows our well documented ‘spring to up-thrust’ empirically observed repeating pattern.
Keep your eye on Friday’s high (87.46). That’s the risk (not advice, not a recommendation).
It should be noted, there’s also potential to up-thrust around the 90.50, area; the location of a 50% retrace (not shown).
Last Friday’s high occurred at the 38%, retrace level.
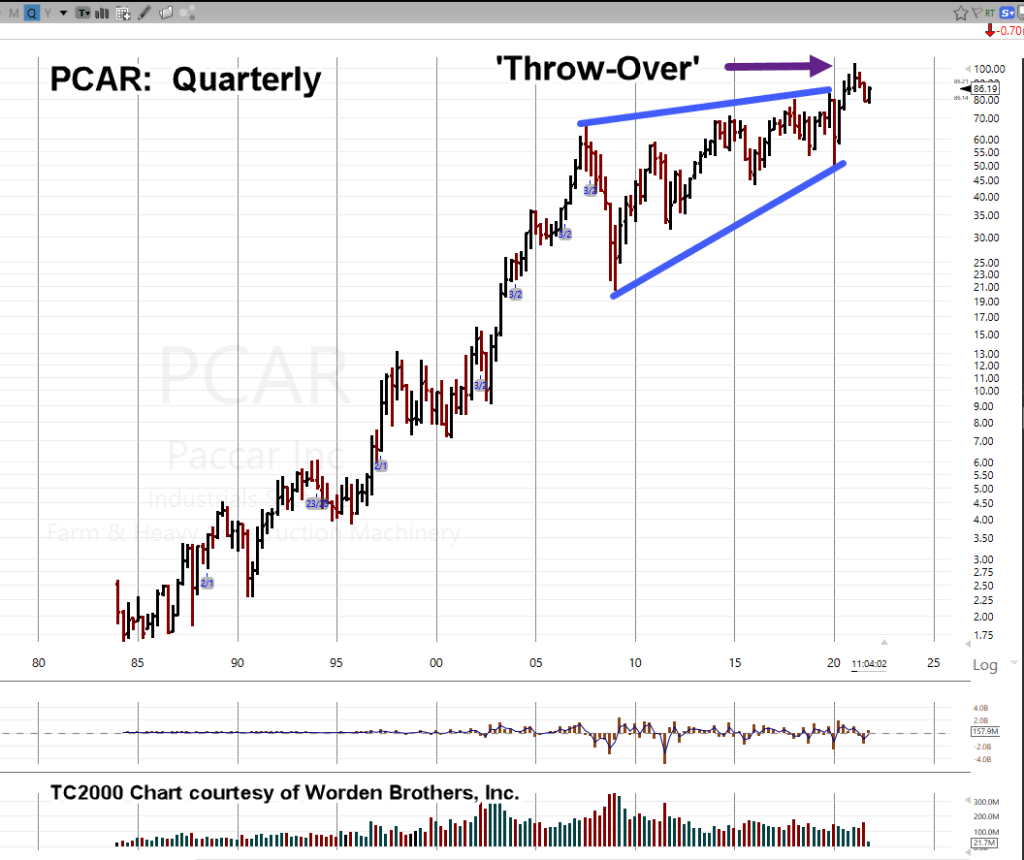
Looking at it from a long term Quarterly perspective, gives us the chart below:
PCAR’s been in a rising (terminating) wedge for years. Now, it looks like the ‘throw-over’ is nearing completion.
What Does It Mean?
Why focus on PACCAR?
Because it’s the builder of trucks that are used to complete the supply chain; from container shipping dock to store-front or distribution facility.
If we do get a solid reversal back into the rising wedge, it signals a long term decline.
As of this post, PCAR is holding steady around 86.50.
Penetration of today’s low (85.45) signals trouble and potential confirmation of the up-thrust.
Stay Tuned
Charts by StockCharts
Note: Posts on this site are for education purposes only. They provide one firm’s insight on the markets. Not investment advice. See additional disclaimer here .
The Danger Point®, trade mark: No. 6,505,279