There’s a lot happening in the biotech sector.
Today, Wednesday, 10/7/20, will be a Fibonacci 144 days from the low of March 16th, this year.
If the all-time high (IBB) was reached on July 20th, Fibonacci day 89 (minus 1), then today may be a critical juncture for the sector.
The current move off the low on September 4th, could be a counter-trend move.
Using the Fibonacci projection tool … a standard addition to most chart packages, we see a possible 1:1, a-b-c projection to the 141.28-area.
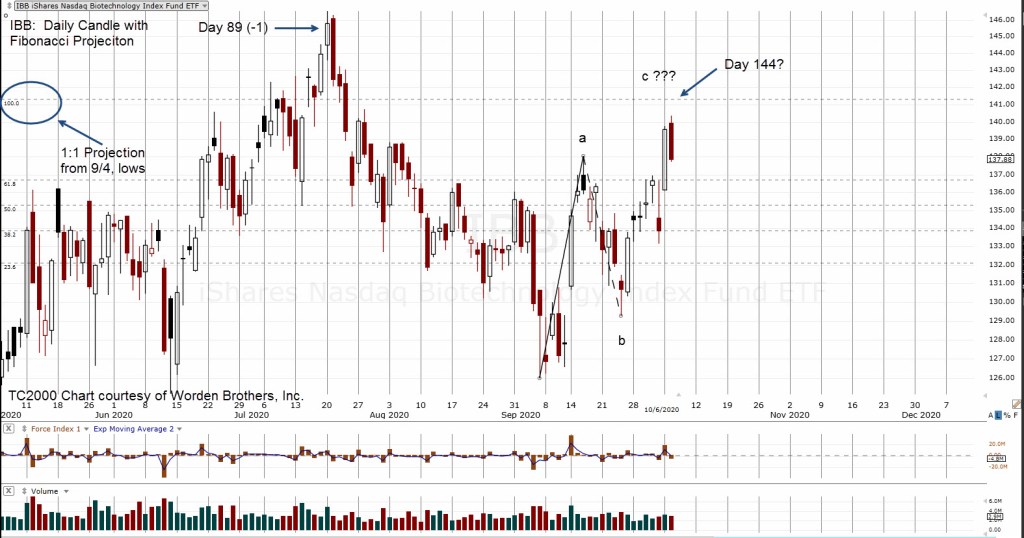
Counter trend moves (a-b-c), typically have equal ‘a’ and ‘c’ waves. The ‘b’’ wave in this case was 76.4%, of the ‘a’ wave … deeper (weaker) than normal.
It just so happens the 141.28- area of IBB also corresponds to a Fibonacci retrace of 76.4% from the 9/4/20, low.
If IBB reaches those levels today and stalls, it’s an indication that at minimum, the market respects this area.
What happens next?
To go short (not advice, not a recommendation) is selling into a rising market.
Technical indicators, MACD, moving averages are all pointing up both on daily and weekly .. although weekly MACD lines are still in a bearish cross-over.
Certainly it’s the danger point. That’s what we’re looking for.
It’s the trader’s discretion on what to do if/when IBB reaches 141.28. From this firm’s perspective, price action behavior itself at the projected level will be the arbiter.
