It’s about two hours after the open.
Newmont (NEM) has already tested upward into its trend-line.
Then, it reversed and makes a new daily low.
Not good for the bullish case.
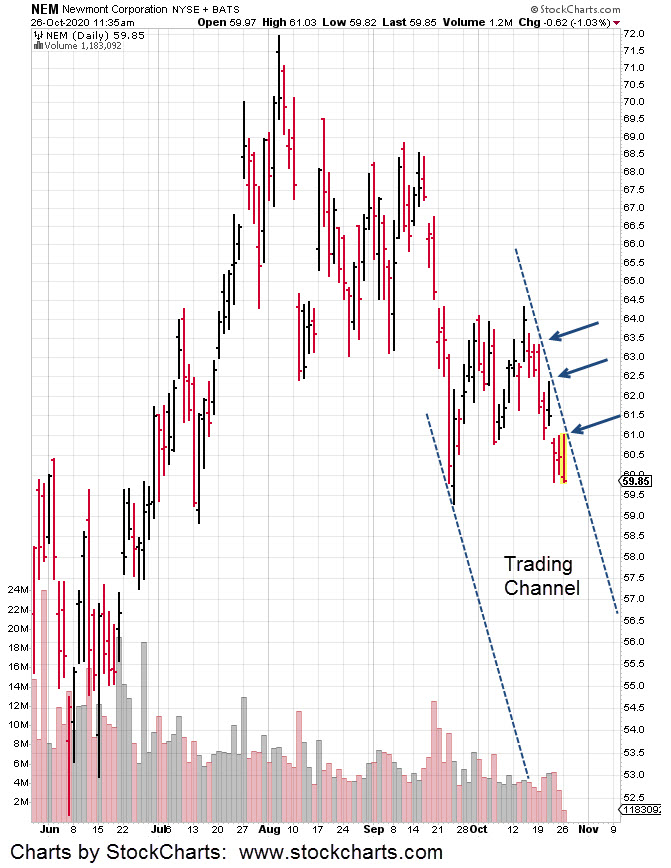
The daily chart shows three hits on the right side line as well as a possible trading channel.
It seems hard to believe. It looks like NEM has seen its highs for the year and possibly much longer.
As always, anything can happen. It’s still very early in the session and there could be a reversal … although a low probability.
Stay tuned.
Charts by StockCharts
