Recent price action now provides a tight range for downside targets.
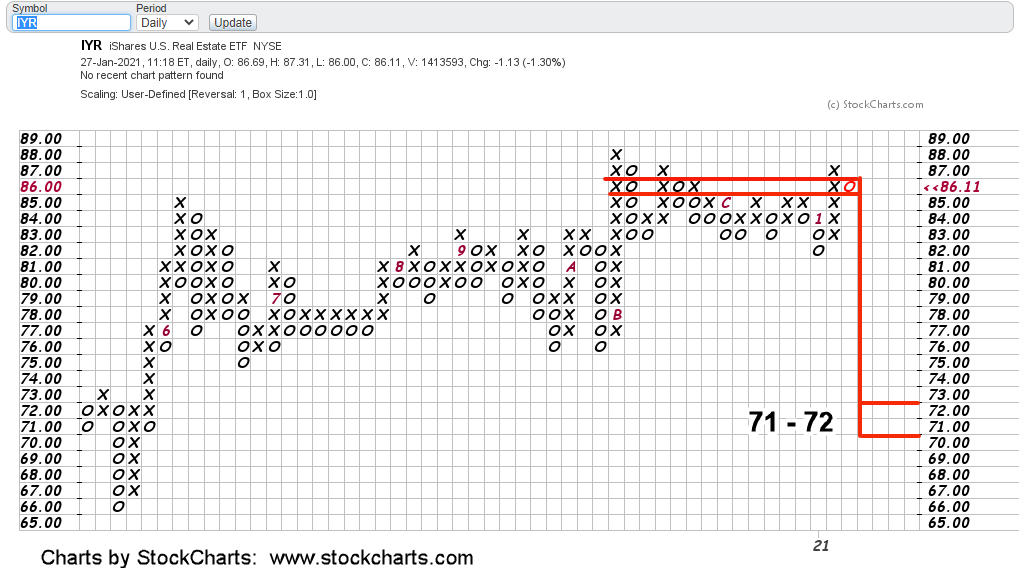
Recall, that P&F charts show potential, not guarantees.
There’s enough congestion in IYR to build significant downside objectives. If we’re at a sustained reversal, then as IYR passes through the 78 – 82 area, it builds even more downside potential.
This is why there’s been so much focus on IYR.
Thinking of it in Elliott Wave terms, if we’re about to begin a Wave 3 (down), it can’t be shorter than Wave 1
That wave (100.75 to 56.27) collapsed a whopping – 44% .
As always, anything can happen. IYR is trading down but right at support. It could get a new lease on life … but probabilities say no.
Charts by StockCharts
