3:37 p.m., EST
Another adverse move in SPBIO and LABD.
Still a short?
We’ve pulled out to the weekly time-frame on inverse fund LABD.
The chart’s been annotated with the same repeating trend line concept but with adjustments.
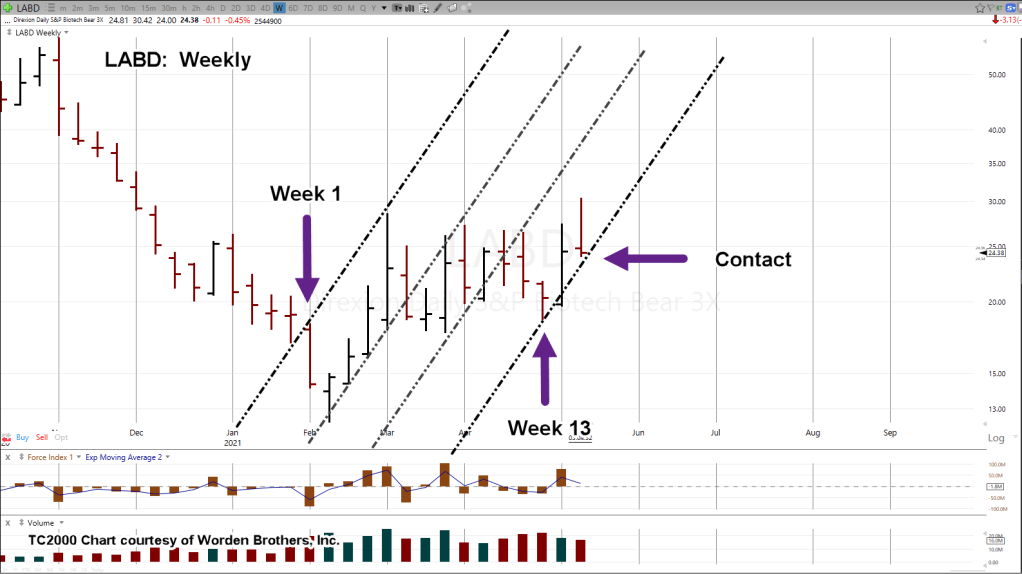
It may seem like an obvious statement but to form a trendline, price action needs to contact that trendline.
The internal lines (slightly lighter shade) show the repeating contact of price action … both on the left side of the lines and the right.
The left-most trend has three contacts. One on the left side before the down arrow and the others on the right.
The right-most trend starts at the low (Week 13) and has a potential push out of trend that returns … which may be in the process of confirmation this week.
This trade is currently being managed (not advice, not a recommendation) with an eye on a potential exit in the fall; possibly October – November time-frame.

Pingback: Breaking Down Biotech « The Danger Point