Note: Posts on this site are for education purposes only. They provide one firm’s insight on the markets. Not investment advice. See additional disclaimer here.
An excellent schematic tutorial on Wyckoff, can be found here.
Going to the link, scrolling down to ‘Distribution’, we have a schematic that includes the notation “UTAD”.
UTAD, stands for, Upthrust After Distribution.
The accompanying text for the schematic indicates the distribution has already taken place; UTAD, is essentially a ‘last gasp’ to see if there’s any more demand.
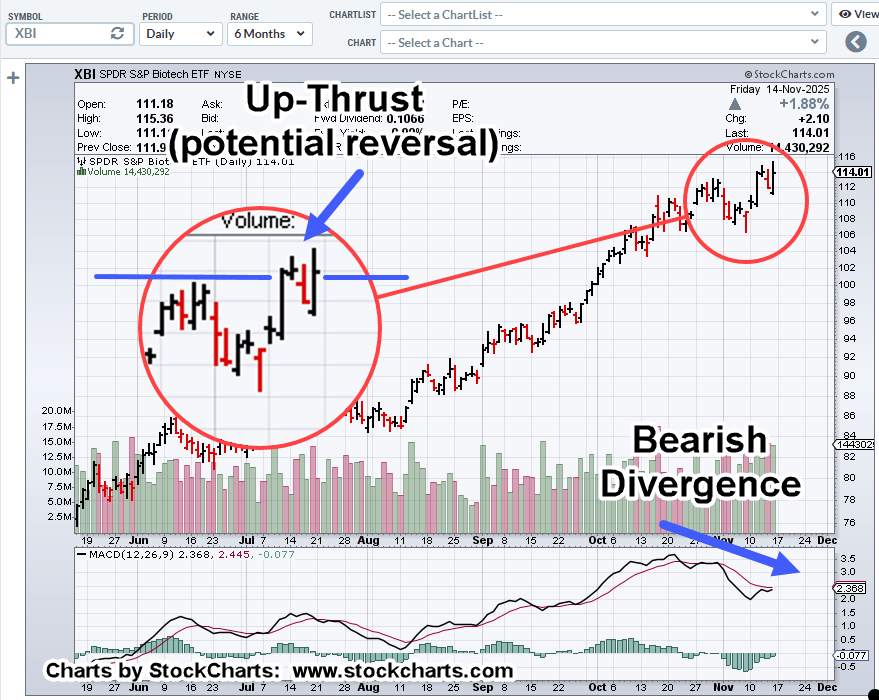
A fascinating question would be, ‘Was the heavy volume associated with this update an indication of distribution?’
Does that mean the subsequent blip higher in this update, was essentially UTAD?
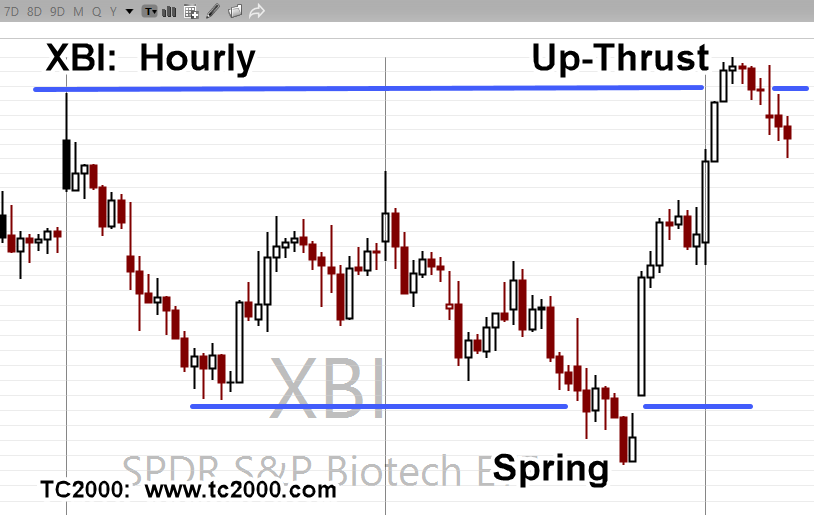
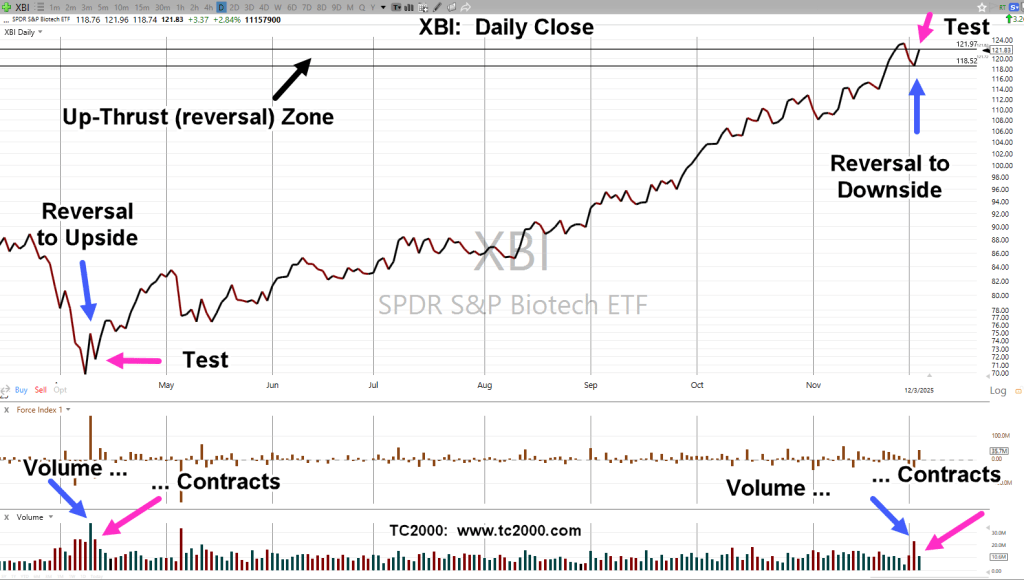
Biotech XBI, Hourly
The heavy volume (potential) distribution is noted.
If this is a correct view of XBI, then right now, it’s at The Danger Point®; where risk on a short is least (not advice, not a recommendation).
Note: Posts on this site are for education purposes only. They provide one firm’s insight on the markets. Not investment advice. See additional disclaimer here.
Note: Posts on this site are for education purposes only. They provide one firm’s insight on the markets. Not investment advice. See additional disclaimer here.
Note: Posts on this site are for education purposes only. They provide one firm’s insight on the markets. Not investment advice. See additional disclaimer here.
Note: Posts on this site are for education purposes only. They provide one firm’s insight on the markets. Not investment advice. See additional disclaimer here.
Note: Posts on this site are for education purposes only. They provide one firm’s insight on the markets. Not investment advice. See additional disclaimer here.
Note: Posts on this site are for education purposes only. They provide one firm’s insight on the markets. Not investment advice. See additional disclaimer here.
Warren Buffett has a massive cash hoard; now, famous short-seller Michael Burry is calling it quits, links here, here and here.
The last time this type of news happened in a big way, was right around the Nasdaq peak in 2000 (not advice not a recommendation).
Back then, ‘old-timers’ with forty-years in the business, were throwing up their hands, throwing in the towel and retiring; the market ‘did not make sense anymore’.
NVDA, CVNA & Biotech
With Nvidia posting a new low today, the analysis shown here, is proving to be accurate thus far (not advice, not a recommendation)
Additionally, Carvana posted an up-thrust (reversal) as presented in this post (not advice, not a recommendation).
Next up, is biotech, XBI.
Biotech XBI, Hourly
We’re in up-thrust condition (potential reversal) have a ‘sign of supply’ and now testing the upside.
Note: The ‘test’ has exceeded the previous high. Although rare, it can happen.
So, is it a test or a continuation of an upside breakout?
The rest of the markets seem to be in a similar condition.
Carvana just posted a new daily high (as of 11:25 a.m., EST), possibly taking out the (early) shorts.
Let’s see if it manages to close above that 332.33, level discussed in this post (not advice, to a recommendation).
Note: Posts on this site are for education purposes only. They provide one firm’s insight on the markets. Not investment advice. See additional disclaimer here.
Note: Posts on this site are for education purposes only. They provide one firm’s insight on the markets. Not investment advice. See additional disclaimer here.
Note: Posts on this site are for education purposes only. They provide one firm’s insight on the markets. Not investment advice. See additional disclaimer here.