Looking For ‘The Pattern’

There was no Oil & Gas, XOP breakout, last Friday.
What did happen as shown on the chart below, was a test of resistance.
The market can certainly reverse from here. If so, it would be called a ‘double top’.
Those types of reversals are common; but from a trading perspective, that’s not what we are looking for (not advice, not a recommendation).
We’re looking for ‘trapped money’.
That means, as many market participants on the wrong side of the trade as possible so they are the ones that provide fuel for the downside.
Marsha … Marsha … Marsha
Just like The Brady Bunch and its chant of ‘Marsha’ … ‘Marsha’ … ‘Marsha’ … we have the public being led into a similar mantra; ‘Inflation’ … ‘Inflation’ … ‘Inflation’.
With that kind of single mindedness, who’s even looking for a downside reversal?
That does not mean a reversal is imminent … it just means the public is not looking for one; in itself, a requirement.
On to the charts
Oil & Gas XOP, Daily
We’ll re-post the original chart to show how price action has progressed.
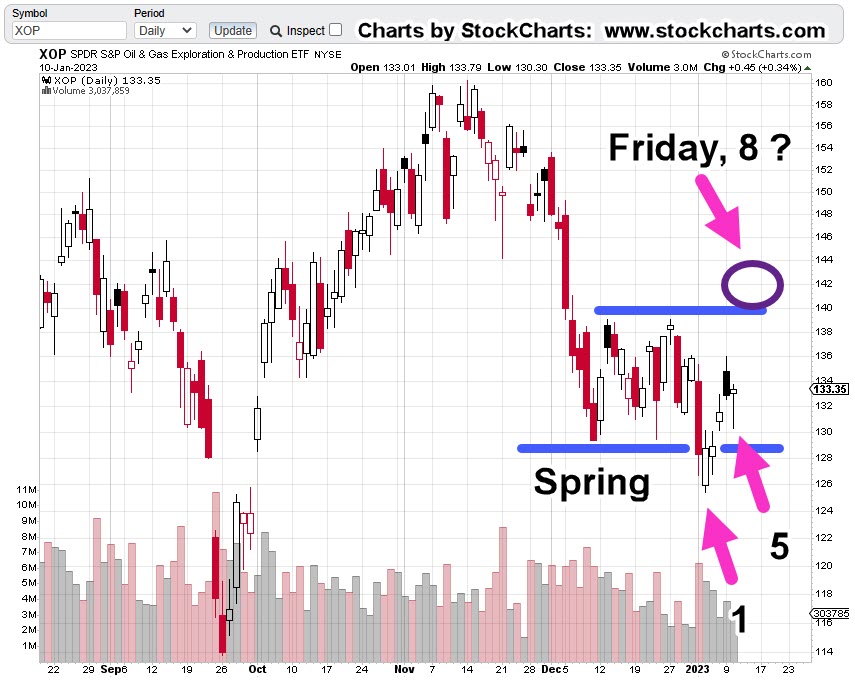
This past Friday marked Fibonacci Day 8.
The next chart is how action looks now.
Included, is a forecast (not advice, not a recommendation) of where and how price action may proceed.
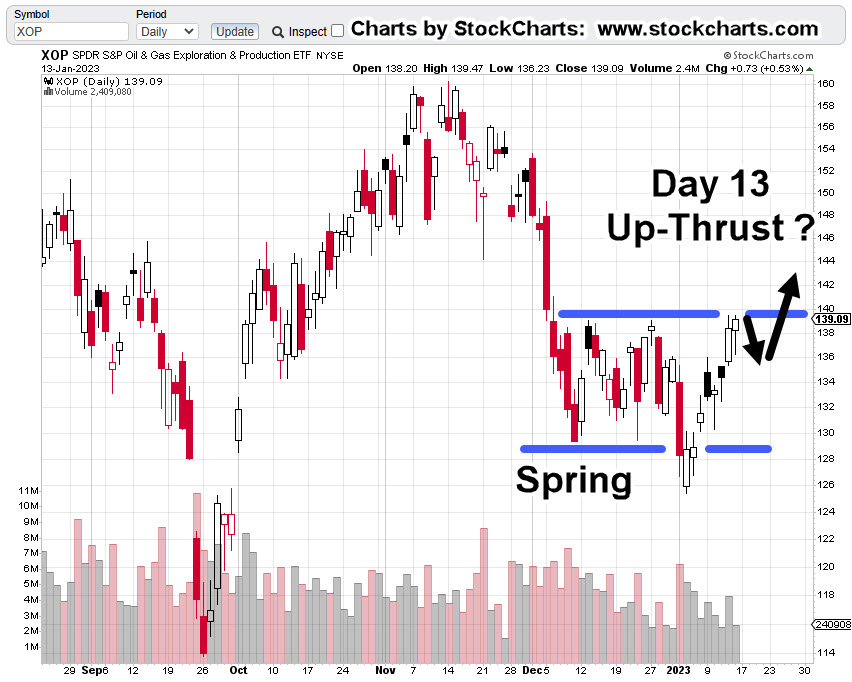
If it’s a double-top, we may have already reversed.
If not, Fibonacci Day 13, might be this coming Friday or next Monday.
It could be as early as Friday (actually, 12-days of price action) based on work done years ago.
That is, when an American Holiday occurs while the rest of the world’s markets remain open, that day of closed markets can (sometimes) effectively count as an actual trading day.
So, it’s this coming Friday, or Monday-next, that may be a set-up for reversal.
Stay Tuned
Charts by StockCharts
Note: Posts on this site are for education purposes only. They provide one firm’s insight on the markets. Not investment advice. See additional disclaimer here.
The Danger Point®, trade mark: No. 6,505,279

Pingback: Oil & Gas … The Reversal « The Danger Point®
Pingback: The Chevron Crack-Up « The Danger Point®