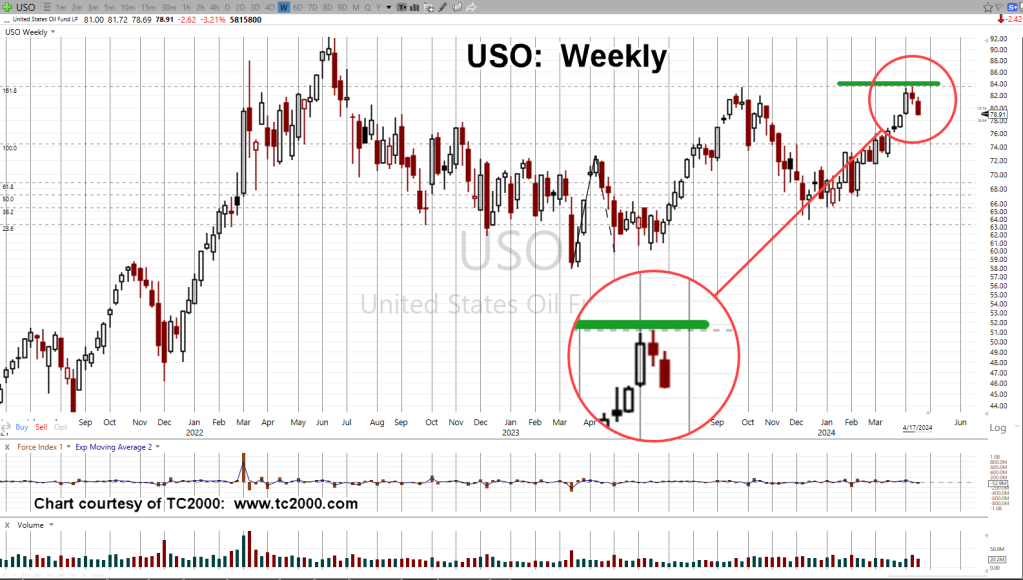
Oil Backs Off … Nat-Gas Bottoms

Charts by StockCharts

Note:  Posts on this site are for education purposes only.  They provide one firm’s insight on the markets.  Not investment advice.  See additional disclaimer here.

‘Bullish … ‘, Gasoline Futures

Charts by StockCharts

Note:  Posts on this site are for education purposes only.  They provide one firm’s insight on the markets.  Not investment advice.  See additional disclaimer here.

Nat-Gas, Goes Negative

Charts by StockCharts

Note:  Posts on this site are for education purposes only.  They provide one firm’s insight on the markets.  Not investment advice.  See additional disclaimer here.

Chevron’s Short Status & Forecast

Options Trade Update

The Put entry on Chevron CVX, was admittedly, late to the party.

From a trading and strategy perspective, when CVX, announced its ‘buy-back‘ program, that was the appropriate time to go short (not advice, not a recommendation).

With that in mind, the Put option detailed in the above link was closed towards the end of yesterday’s session.

Chevron could still collapse from here and that may ultimately be the outcome.

However, before that happens, as shown below, the more probable event is to come back up for a test of underside resistance.

Chevron CVX, 4-Hour

Note how thrust energy (blue arrow) to the downside is dissipating.

The chart below shows a potential outcome, if (and it’s a big if) CVX, is still in a significant reversal.

Examples presented on this site are just that: Examples

They show one “old-timer’s” perspective on the market and current events.

The examples can be used (or not) to aid in understanding market behavior or to show a different perspective on how to approach the current environment.

To paraphrase Dr. Alexander Elder:

‘There are many ways to make money in the markets … and even more ways to lose it’.

It’s about 20-minutes before the open. Let’s see what happens next.

Stay Tuned

Charts by StockCharts

Note:  Posts on this site are for education purposes only.  They provide one firm’s insight on the markets.  Not investment advice.  See additional disclaimer here.

The Danger Point®, trade mark: No. 6,505,279

The Chevron Crack-Up

A Long Way Down

The breakdown in Chevron (CVX) could spell real trouble.

The Oil & Gas Sector has already been covered extensively over the entire month of January.

Prior posts are here, here, here, here, here and here.

Some of the analysis was negated by subsequent price action and some of it not. This is the way of the markets.

However, the main theme was, this sector’s at an extreme, at risk for a major, swift and sustained downturn (not advice, not a recommendation).

Additional data that indicated extremes, including the Chevron (CVX) buy-back are below:

WTI ‘Cushing‘ Build Report

Investors ‘surge‘ back into oil.

Events like this, tend to indicate the end of a move.

Then today, Chevron (CVX) cracks.

In keeping with Elder’s method of trading options, as was done with the Delta Airlines (DAL) trade, the chart is documented below.

Note: The Delta Put expired with no revenue on the trade. This is how the method is implemented. Many small losses that are peppered by a significant gain (not advice, not a recommendation).

Chevron CVX, Daily

Over the next week, CVX could get ahold if itself and stabilize … or it could completely fall apart (not advice, not a recommendation).

We can already see, it appears to have posted a double top with a swift reversal.

Probabilities favor the downside.

Stay Tuned

Charts by StockCharts

Note:  Posts on this site are for education purposes only.  They provide one firm’s insight on the markets.  Not investment advice.  See additional disclaimer here.

The Danger Point®, trade mark: No. 6,505,279

Oil & Gas … Reversal ?

Yesterday, Was ‘Day 13’

Monday was Fibonacci ‘Day 13’ from the January 4th, XOP, lows.

With about fifteen-minutes before the open, pre-market action in the XOP leveraged inverse fund DRIP, is trading slightly higher at 12.67.

So, was yesterday the day? Has XOP topped-out and now in the process of reversal?

As always with the markets, the price action itself, will show us the truth.

However, what can be stated with some confidence, is that we’re at a low-risk point for going short (not advice, not a recommendation).

‘Low-risk’, does NOT mean ‘no-risk’

XOP, New Low or New High

It’s somewhat straightforward at this point.

If XOP, posts a new daily low, it increases the probability of reversal. If it posts a new daily high, then price action is possibly on to new all-time highs.

Oil & Gas XOP, Daily Close

The daily chart shows the labored six weeks of rounded top that’s identified as ‘Up-Thrust’.

At present, XOP is testing the underside of that Up-Thrust.

The zoom version of the chart shows the amount of upside effort expended during the rounded top.

Price action spent over a month attempting to move higher, only to collapse into a downside reversal.

Now, we can see that wide price action area is being tested; not unlike the Newmont test as described here.

It’s what the market does.

Stay Tuned

Charts by StockCharts

Note:  Posts on this site are for education purposes only.  They provide one firm’s insight on the markets.  Not investment advice.  See additional disclaimer here.

The Danger Point®, trade mark: No. 6,505,279

Oil … Gas … Gold & Newmont

Markets, At Critical Juncture

Nemont Mining (NEM), Gold, and the Oil & Gas Sector are at a critical juncture.

The rest of the major indices, Dow, S&P, QQQs, real estate (IYR), and so on, are in a similar position.

For this update, we’ll focus on Newmont (NEM), as it’s the largest cap in the Senior Mining Sector GDX, and a general representative of the commodities markets.

Financial collapse is a process, not an event.

Newmont topped-out in April, of last year. Exxon, the proxy for the Oil & Gas sector, may have reached its highs this past November.

Where’s The Inflation?

As Michael Cowan has just reported, banks are absconding with depositor’s money under the guise of ‘bail-in’.

If the fiat cash is so worthless, why are banks seizing it?

As Robert Prechter Jr., said years ago, ‘all fiat cash ultimately goes to zero’; the end game (most likely) for the dollar. However, it could be months, years, or even a decade before that happens.

For right now, today, this minute, the data is showing us, the banks want the money; ‘Show me the money‘.

With that, let’s look at the non-existent ‘inflation’ in the mining sector.

Newmont Mining NEM, Weekly

The first chart identifies the heavy volume and then test of wide price bars. This behavior is common in the markets; they tend to come back and test wide high-volume areas.

Next, we see there’s a terminating wedge developing as volume declines; the inference, is lack of significant commitment at these price levels.

We’ll get close-in on the wedge; last week printed a lower weekly low and closed lower for the week.

There’s no breakdown of the wedge … yet.

At this juncture, it’s up to the bulls to show they’re still in control.

Inflation vs. Scarcity

We have without a doubt, the effects of the event from the past three years gaining momentum. Whether or not those effects reach a peak this year, is unknown.

A lot of the mainstream and YouTuber’s alike talk about the upward move in gold as the result of ‘inflation’.

Here’s a little bit of insight you’ll not find anywhere else; how about gold rising because the above mentioned ‘effects‘ are causing production volumes to decline?

Maybe it’s because of scarcity (along with nearly everything else) that’s causing the increase in price.

Just to drive that idea home, the latest total gold production numbers, listed here.

Gold production for 2020 dropped -8.2%, from the year prior. Year 2021 was down -1%, from 2020.

From 2010 to 1019, gold production increased or was flat year over year … that is, until 2020.

Stay Tuned

Charts by StockCharts

Note:  Posts on this site are for education purposes only.  They provide one firm’s insight on the markets.  Not investment advice.  See additional disclaimer here.

The Danger Point®, trade mark: No. 6,505,279

Oil & Gas … The Reversal

Form, Is First … Time, Is Next

With Price Action … form is first, then time.

There was a larger than expected crude inventory build, as ‘the consumer is weaker than expected’.

The ‘consumer’ is not weaker than expected, they’re tapped out.

There’s real potential, events accelerate from here.

The reversal in the sector, XOP, was anticipated to happen on Friday, tomorrow.

At this point, it looks like it came early.

The daily chart of XOP, below shows a reversal at the Fibonacci 50%, retrace.

Oil & Gas XOP, Daily

The next chart zooms-in on the reversal.

We’re about fifteen-minutes before the regular session and set to open lower.

Look for the market to print lower, then attempt a rally as a test of the reversal.

That retrace, if it occurs, may be a low-risk area for a short via DRIP (not advice, not a recommendation).

If the anticipated test fails, and price action makes a new daily high (above yesterday’s print), it’s then likely the sector is on its way to all-time highs.

Stay Tuned

Charts by StockCharts

Note:  Posts on this site are for education purposes only.  They provide one firm’s insight on the markets.  Not investment advice.  See additional disclaimer here.

The Danger Point®, trade mark: No. 6,505,279

Oil & Gas … Breakout Update

Looking For ‘The Pattern’

There was no Oil & Gas, XOP breakout, last Friday.

What did happen as shown on the chart below, was a test of resistance.

The market can certainly reverse from here. If so, it would be called a ‘double top’.

Those types of reversals are common; but from a trading perspective, that’s not what we are looking for (not advice, not a recommendation).

We’re looking for ‘trapped money’.

That means, as many market participants on the wrong side of the trade as possible so they are the ones that provide fuel for the downside.

Marsha … Marsha … Marsha

Just like The Brady Bunch and its chant of ‘Marsha’ … ‘Marsha’ … ‘Marsha’ … we have the public being led into a similar mantra; ‘Inflation’ … ‘Inflation’ … ‘Inflation’.

With that kind of single mindedness, who’s even looking for a downside reversal?

That does not mean a reversal is imminent … it just means the public is not looking for one; in itself, a requirement.

On to the charts

Oil & Gas XOP, Daily

We’ll re-post the original chart to show how price action has progressed.

This past Friday marked Fibonacci Day 8.

The next chart is how action looks now.

Included, is a forecast (not advice, not a recommendation) of where and how price action may proceed.

If it’s a double-top, we may have already reversed.

If not, Fibonacci Day 13, might be this coming Friday or next Monday.

It could be as early as Friday (actually, 12-days of price action) based on work done years ago.

That is, when an American Holiday occurs while the rest of the world’s markets remain open, that day of closed markets can (sometimes) effectively count as an actual trading day.

So, it’s this coming Friday, or Monday-next, that may be a set-up for reversal.

Stay Tuned

Charts by StockCharts

Note:  Posts on this site are for education purposes only.  They provide one firm’s insight on the markets.  Not investment advice.  See additional disclaimer here.

The Danger Point®, trade mark: No. 6,505,279

Oil & Gas … Breakout on Friday?

Repeating Pattern … ‘Spring-to-Up-Thrust’

When Oil & Gas Sector XOP, pushed above last week’s high, it negated the breakdown scenario.

At the same time, it opened another potential opportunity that may set-up this coming Friday … The 13th.

We’ve shown over and again, markets tend to exhibit repeating patterns. Things like trading ranges, terminating wedges, breakouts and breakdowns, are not new.

However, there’s a lesser-known characteristic; the tendency for a market to go straight from a Wyckoff ‘spring’, into an ‘up-thrust’.

That phenomenon is described at this link.

Currently, we’re about mid-way into the set-up as shown on the daily chart of XOP.

Oil & Gas XOP, Daily

Price action pushed below support (the spring set-up) and is now mid-way into that spring; potentially going straight into an up-thrust.

There was a reversal pivot on Fibonacci Day 5 (yesterday), which opens up the possibility of another time correlation at Fibonacci Day 8 … this coming Friday.

Before The Open

It’s about twenty-minutes before the regular open and XOP, is trading higher … further confirming we’re headed for a potential set-up and reversal (not advice, not a recommendation).

Stay Tuned

Charts by StockCharts

Note:  Posts on this site are for education purposes only.  They provide one firm’s insight on the markets.  Not investment advice.  See additional disclaimer here.

The Danger Point®, trade mark: No. 6,505,279