Straight Up … Into Resistance

Q: How do you know it’s a squeeze?
A: Price action goes straight-up, then collapses.
So, we won’t know for sure, until a downside reversal (not advice, not a recommendation).
Right now (as of 10:57 a.m., EST), we’re at the ‘straight-up’ part.
The INTC, 15-minute chart below, shows the action.
Intel INTC, 15-minute
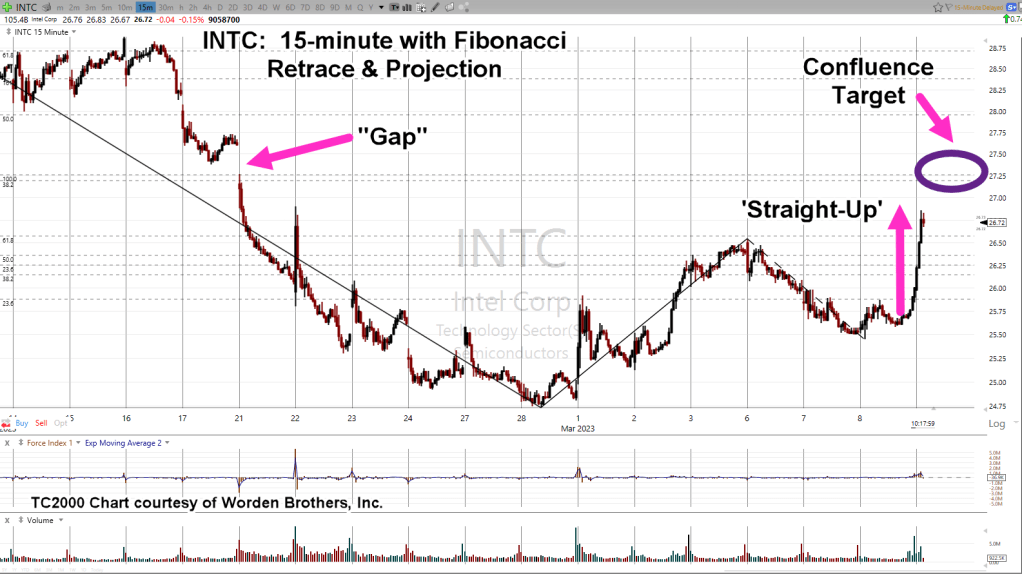
There’s a lot going on in the chart.
We have a ‘confluence’ of Fibonacci retrace and projection at the 27.25 area.
In addition, there is a price gap in the vicinity of 27.50
Once again, if it’s a short squeeze, it won’t be known for sure until it’s all over and price collapses.
One thing that can be said with some confidence, if INTC reaches 27.25 – 27.50, that puts it at The Danger Point®
Stay Tuned
Charts by StockCharts
Note: Posts on this site are for education purposes only. They provide one firm’s insight on the markets. Not investment advice. See additional disclaimer here.
The Danger Point®, trade mark: No. 6,505,279

Pingback: Intel (INTC) Meets Target, Stalls « The Danger Point®