Almost There … On Top Of Resistance

Here’s an obvious statement.
If silver’s going to breakout into ‘the big one’, it has to go higher (much higher) from here.
Can we say at this juncture, the press and ‘investors’ alike, are at max hyperbole?
Straight Out of The Bog
Here are just a few titles from the boggy moor, otherwise known as YouTube:
‘100% Certainty …’
‘Gold’s about to shock …’
‘… Warning to you all …’
‘… Prepare for the biggest rally ever ….’
And on it goes.
However, somehow finding its way out of the mire, we do have this: Bearish Reversal in Gold & Silver, link here.
From that link, and in Wyckoff terms, price action of ETF silver junior miner SILJ, is the clearest of the others, GDX and GDXJ.
Depending on how it goes this coming week, we’ll cover that ETF in a future update.
Now, back to silver. Does the actual truth, the chart, agree with the hype?
Silver SLV, Weekly
Since the last update SLV, reversed (higher) through what the market decided, was an intermediate resistance zone.
As shown below, SLV has pushed above the ‘last’ resistance and has come back to ‘test’.

Last week’s volume is shown as a red bar. Some prior red bars of similar size are highlighted on the chart.
This time could be different but the last time(s) such ‘negative’ volume occurred, resulting price action in SLV, was either sideways or down.
But wait, there’s more. The chart below shows SLV, has met or is near a measured move target.
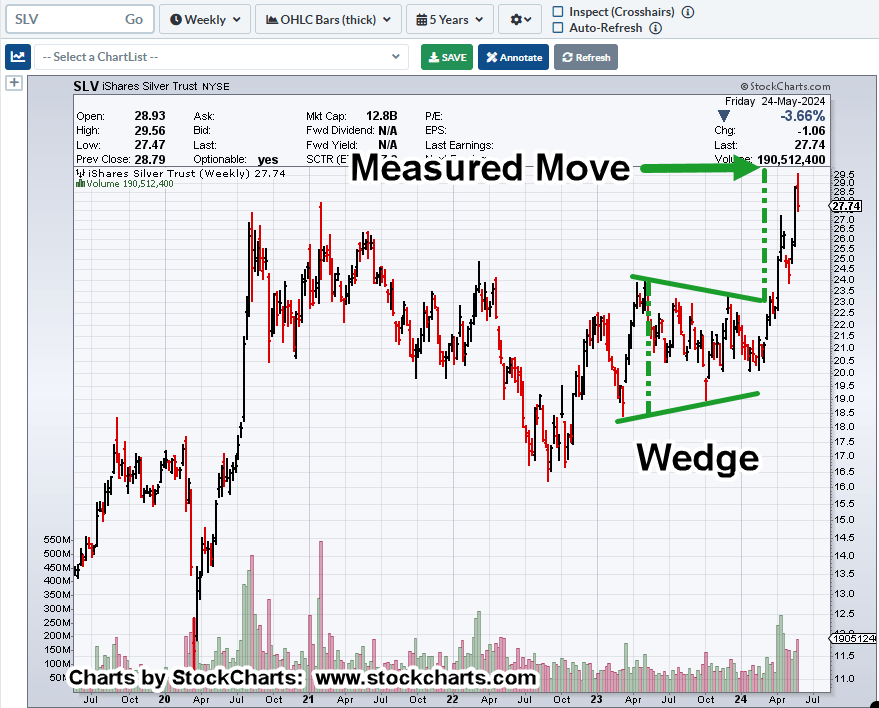
The coming week could see SLV, inch its way higher to the measured move or continue the testing (possibly, reversal) action it started last week.
Stay Tuned
Charts by StockCharts
Note: Posts on this site are for education purposes only. They provide one firm’s insight on the markets. Not investment advice. See additional disclaimer here.
The Danger Point®, trade mark: No. 6,505,279

Pingback: Silver Top … Part VI « The Danger Point®