Bubbles, Side-by-Side

Here’s something a little different.
Two trend breaks are shown side-by-side.
Without looking at prior updates, which chart is the internet (QQQ) bubble break and which chart is the A.I. (SOXX), bubble break?
We’ll cue the Jeopardy music while you pick. 🙂
And now, for the reveal
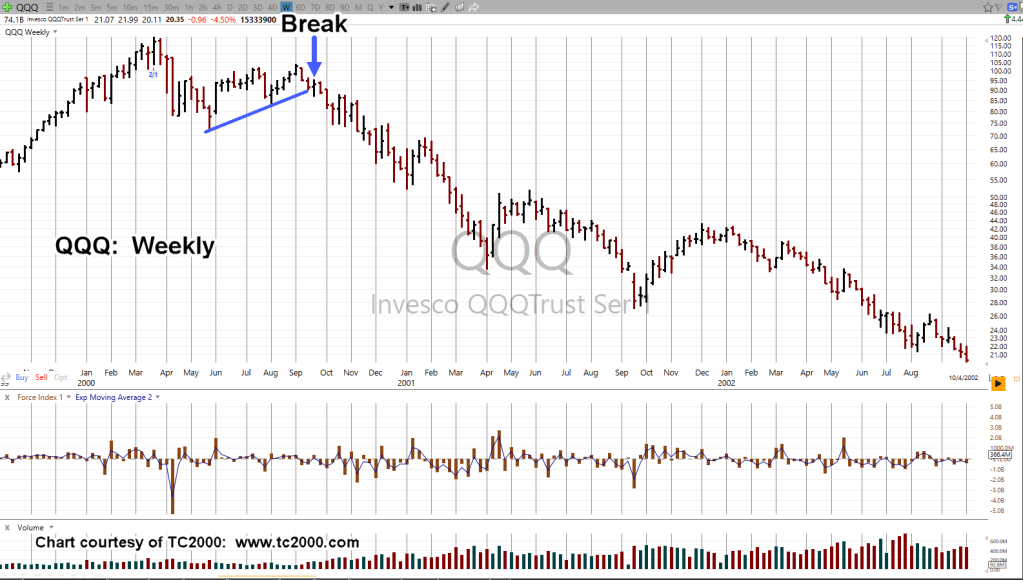
Internet Bubble QQQ, Weekly
The chart segment on the right, is the internet bubble of the 2000s.
There’s no ‘rest of the story’ with the SOXX.
That story has yet to happen (not advice, not a recommendation).
Stay Tuned
Charts by StockCharts
Note: Posts on this site are for education purposes only. They provide one firm’s insight on the markets. Not investment advice. See additional disclaimer here.
The Danger Point®, trade mark: No. 6,505,279

Pingback: Broadcom … Explodes !!! « The Danger Point®