Note: Posts on this site are for education purposes only. They provide one firm’s insight on the markets. Not investment advice. See additional disclaimer here.
For those who were there in 1987, and later in 2000, the market’s rise was relentless … until it wasn’t.
With the SOXX pushing through to new highs (all shorts closed), one gets the feeling, unless there’s a reversal soon, we’ve now entered a very dangerous stage a la 1987 (not advice, not a recommendation).
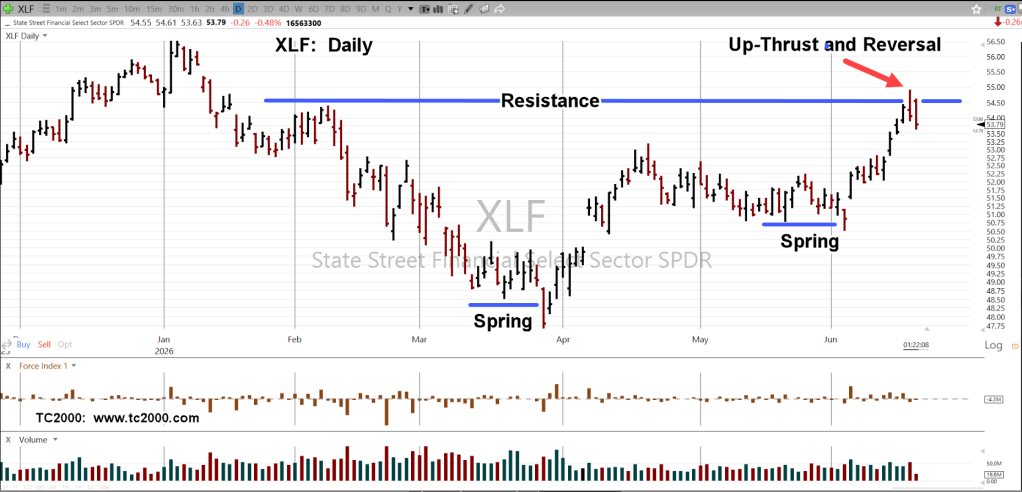
The bond market’s signaling that ‘something’s up’. The financials (XLF) have just topped and reversed. Banking (KRE) appears to be at some kind of top and on it goes.
Financial Sector XLF, Daily
If I was short this sector (FAZ-26-01), the stop would be today’s high (not advice, not a recommendation).
Note: Posts on this site are for education purposes only. They provide one firm’s insight on the markets. Not investment advice. See additional disclaimer here.
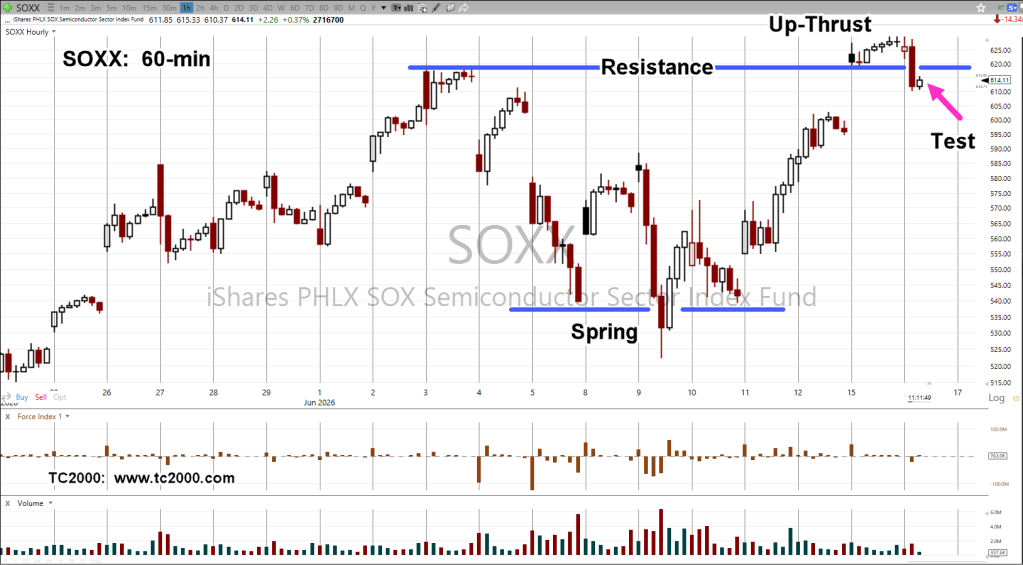
“If the SOXX stalls here and either reverses today (below resistance) or prints a new daily low tomorrow, then we’re at The Danger Point®”
Well, ladies and gentlemen; pre-market top 633 as noted and now, early in the session, a new daily low.
Semiconductors SOXX, Hourly
Currently testing underside resistance.
Of course, anything can happen. The SOXX could recover and move on to new all-time highs.
However, since posting a new daily low, below established resistance, we’re at The Danger Point® where risk on a short position is least (not advice not a recommendation).
Note: Posts on this site are for education purposes only. They provide one firm’s insight on the markets. Not investment advice. See additional disclaimer here.
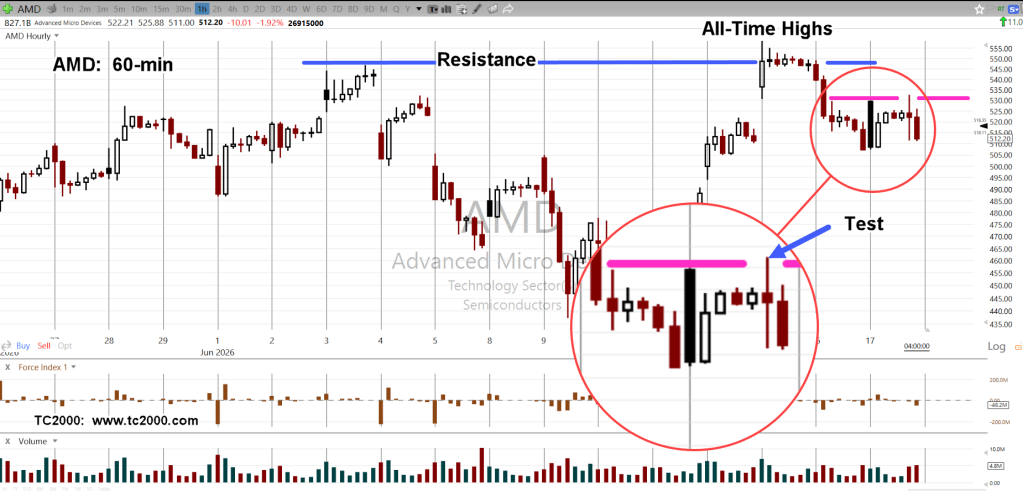
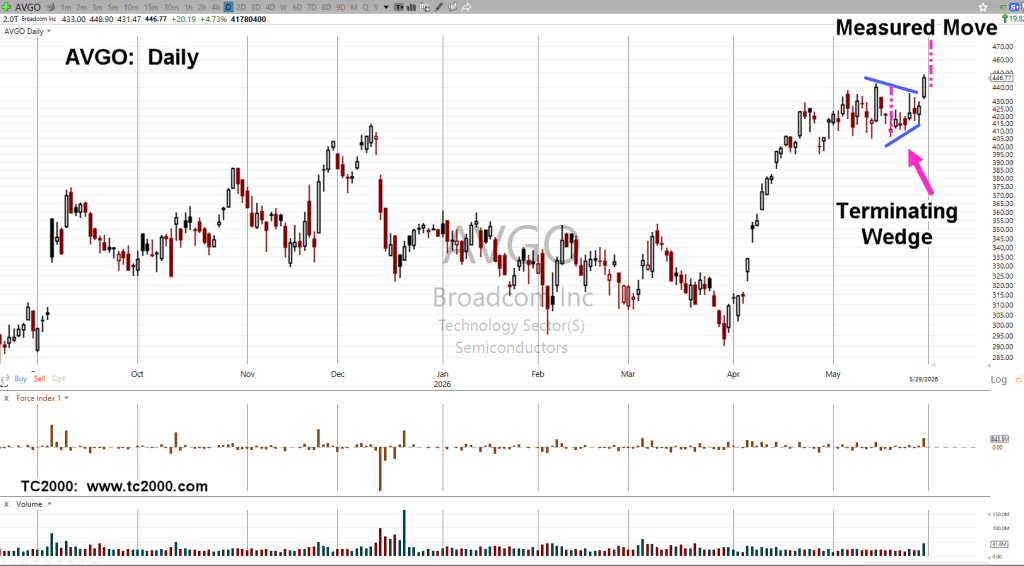
With all eyes on Broadcom’s earnings release scheduled for Wednesday, other markets in the sector are giving clues we may be near a reversal (not advice not a recommendation).
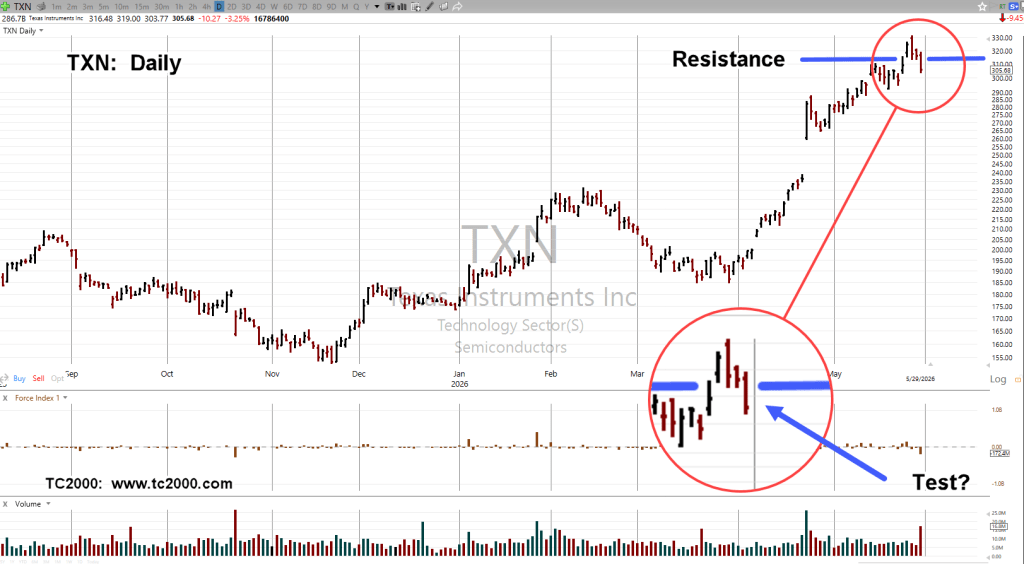
One of those, is Texas Instruments.
As can be seen, TXN has failed to move above resistance.
The question for Monday; will TXN quietly retrace upward to test the underside?
Note: Posts on this site are for education purposes only. They provide one firm’s insight on the markets. Not investment advice. See additional disclaimer here.
In basic terms: The brain’s ability to be flexible, re-wire neural connections, perform ‘thought experiments’
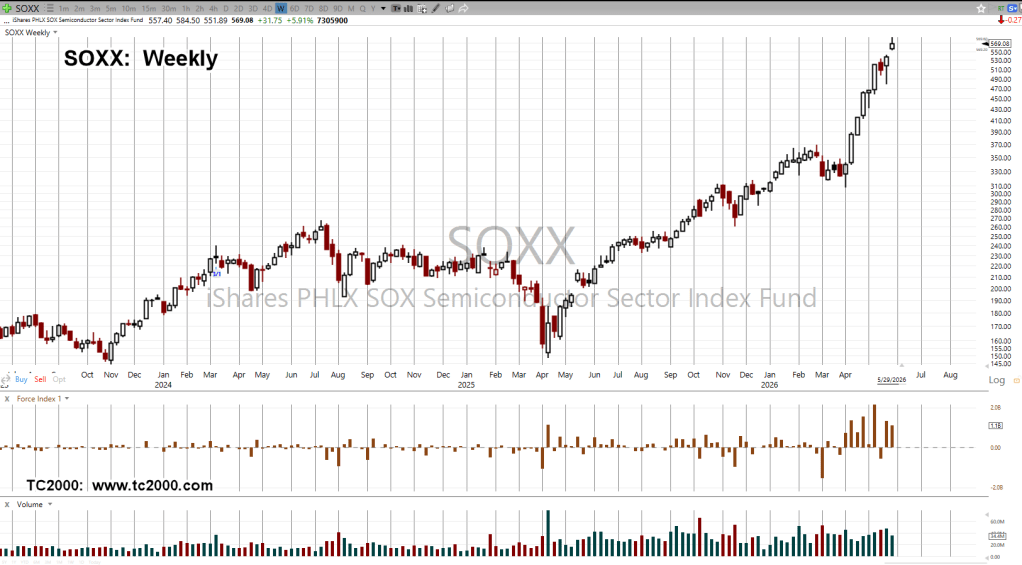
With that said, let’s look at the weekly chart of the SOXX.
Semiconductors SOXX, Weekly
First, the unmarked chart.
We’re searching for Fibonacci correlations.
Nothing seems to jump out.
Looking at the chart and following the ‘rules’, leads us to counting from (any) lows to highs (or vice versa), looking for a sequence.
We get some for a while, but then, they diffuse into nothingness.
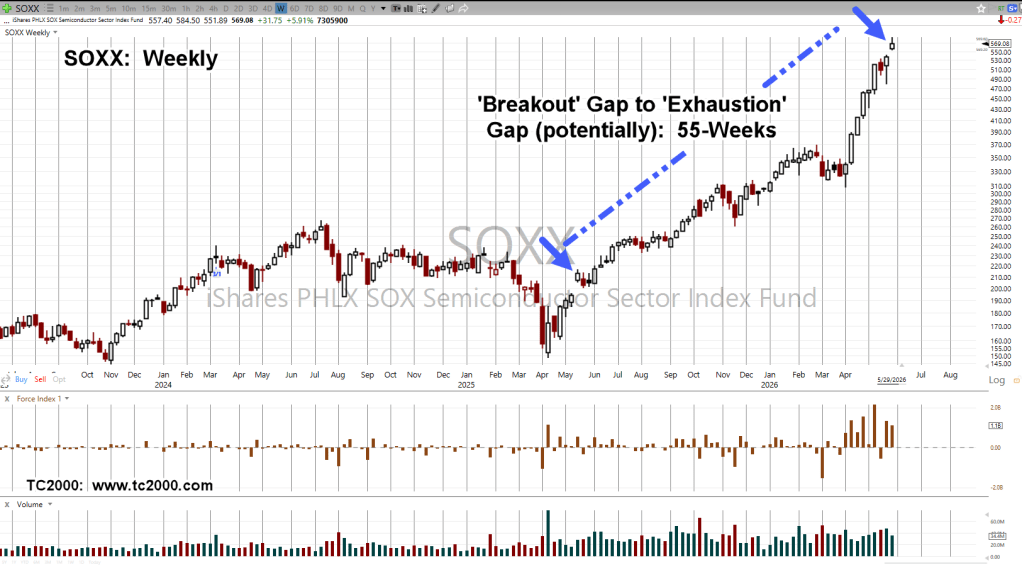
However, when performing a thought experiment (i.e., don’t follow the rules), we have this:
From the breakout gap, to what could be the exhaustion gap, is a Fibonacci 55-Weeks (not advice, not a recommendation).
Daily Correlation
When looking at the daily chart (not shown), there’s a Fibonacci correlation as well.
From the breakout gap of Wednesday April 8th, to the (potential) exhaustion gap on Tuesday May 26, is Fibonacci 34 days (not advice, not a recommendation).
Note: Posts on this site are for education purposes only. They provide one firm’s insight on the markets. Not investment advice. See additional disclaimer here.
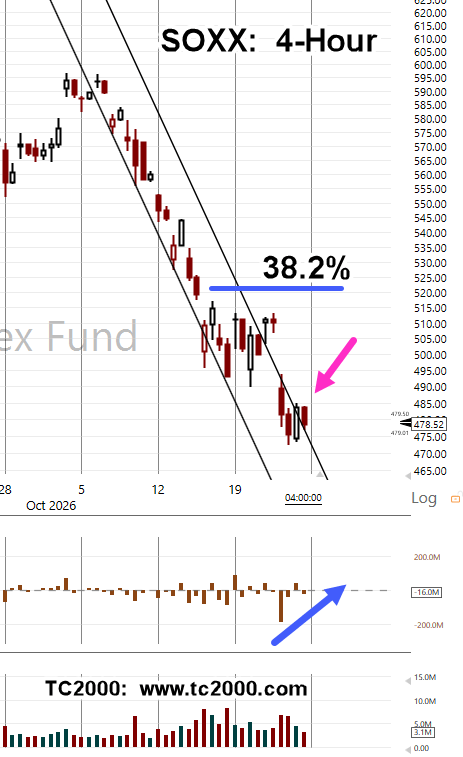
Even with that, we still have what looks like an exhaustion gap, yet to be filled (chart below).
Taking the entire pre-market and after-market sessions into account, as of this post (5:45 p.m., EST), the SOXX has retraced to near the 38% level (not advice, not a recommendaiton).
Note: Posts on this site are for education purposes only. They provide one firm’s insight on the markets. Not investment advice. See additional disclaimer here.
When you add it all up, if the SOXX was going to reverse from all-time highs into a sustained correction, Friday’s close would be a good place to start (not advice, not a recommendation).
Prior updates have been consistent with the (Wyckoff) premise, upward thrusts are covering less net distance.
SOXX Hourly Details
First, the markets are fractal.
We see the same repeating pattern of ‘spring to up-thrust’, on the hourly as on longer timeframes.
Second, tops and bottoms are different.
The characteristic of the ‘spring’ bottom and the ‘up-thrust’ top are how markets behave.
Bottoms, ruled by fear, typically sharp and well defined.
Tops, ruled by hope, typically wide and rounded.
Semiconductors SOXX, Hourly
The top shown above, is what David Weis used to call, The Danger Point®, where risk (cost) of being wrong (on a short, in this case), is least.
In his video, he points out this type of action, saying ‘the market could just keep on going … so what’.
His meaning was, it’s the point where there’s instability, therefore, potential for reversal (not advice, not a recommendation).
For those who don’t have that video, it is timeless wisdom, still available here.
Note: Posts on this site are for education purposes only. They provide one firm’s insight on the markets. Not investment advice. See additional disclaimer here.